Fig. 1.
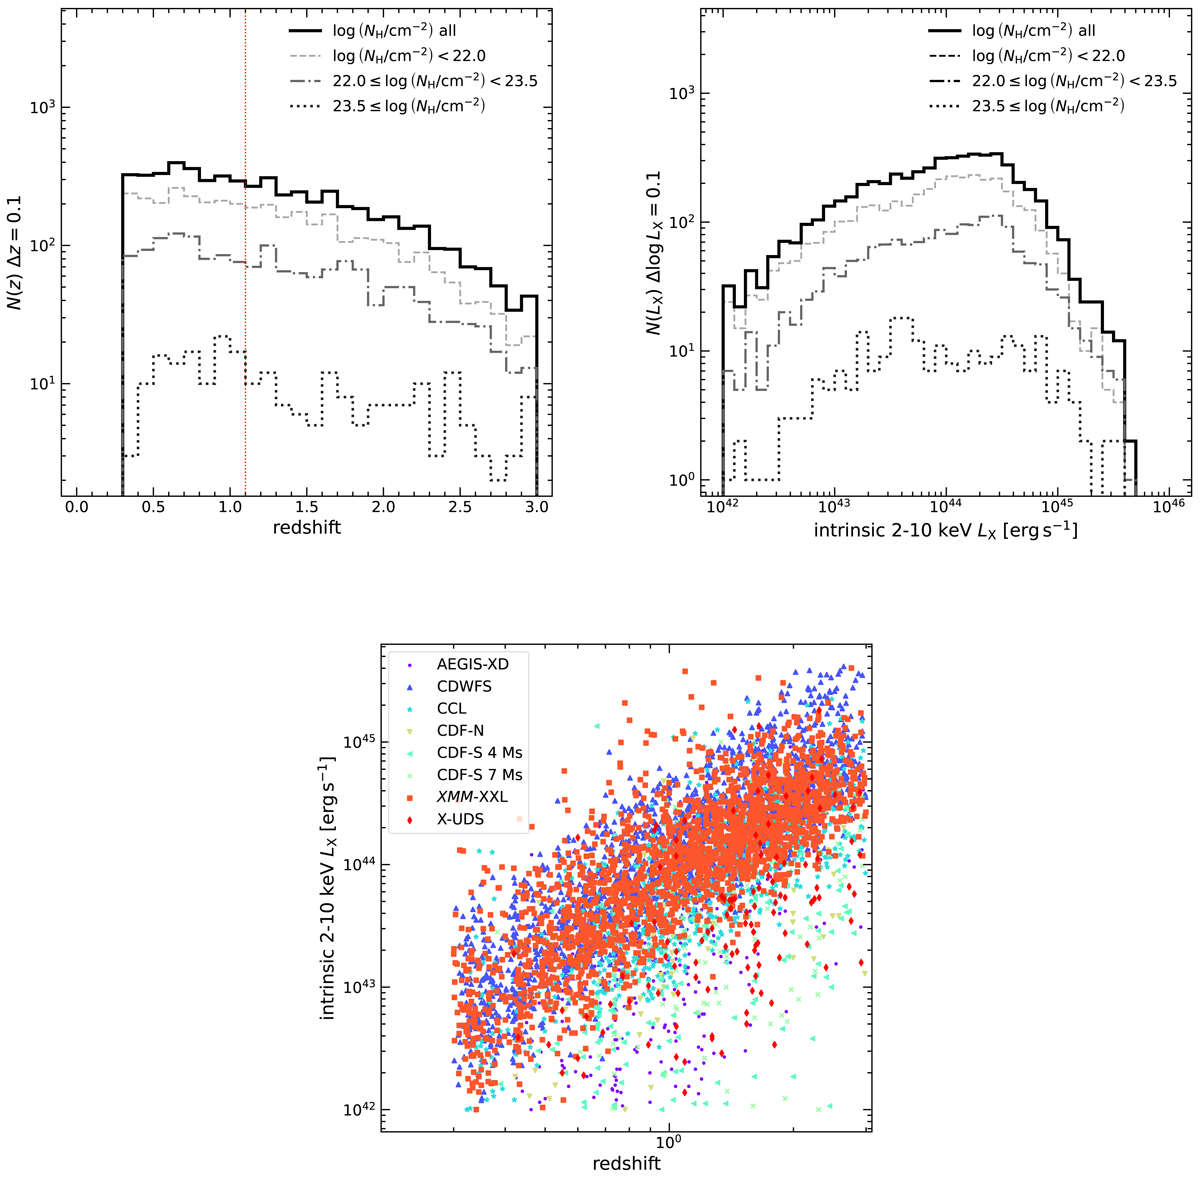
Download original image
Distribution of redshift, z, and intrinsic 2 − 10 keV X-ray luminosity, LX, of the combined X-ray AGN sample with spectroscopic redshifts 0.3 ≤ z < 3 and LX > 1042 erg s−1. The top-left panel shows the redshift distribution for the obscuration samples selected via hydrogen column density, NH, as indicated in the legend. The vertical red line indicates the low and high redshift bins. The top-right panel shows the distribution of LX using the same line styles. The bottom panel shows the redshift against the intrinsic 2 − 10 keV X-ray luminosity; different colors and markers indicate the various surveys used.
Current usage metrics show cumulative count of Article Views (full-text article views including HTML views, PDF and ePub downloads, according to the available data) and Abstracts Views on Vision4Press platform.
Data correspond to usage on the plateform after 2015. The current usage metrics is available 48-96 hours after online publication and is updated daily on week days.
Initial download of the metrics may take a while.