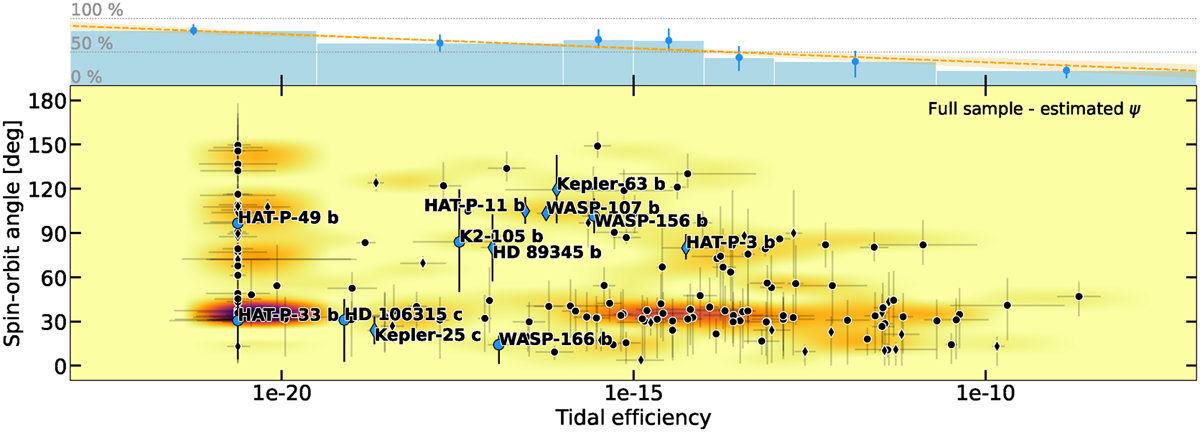
Fig. 7
Download original image
Same as Fig. 5, but with 3D obliquities for all systems. ψ is estimated for systems that only have a sky-projected measurement using the procedure outlined in Sect. 4.1. We note the different vertical range for the blue bar plot on the top of the figure as compared to Fig. 5. The bar plot is built according to the procedure described in Sect. 4.3. The orange dashed line on the bar plot is the best linear fit between the misalignment fraction and the tidal efficiency, with the orange shaded area around it shown as its lσ envelope. The bar plot, along with its linear fit, is also separately shown in Fig. 8 for clarity.
Current usage metrics show cumulative count of Article Views (full-text article views including HTML views, PDF and ePub downloads, according to the available data) and Abstracts Views on Vision4Press platform.
Data correspond to usage on the plateform after 2015. The current usage metrics is available 48-96 hours after online publication and is updated daily on week days.
Initial download of the metrics may take a while.