Fig. 2
Download original image
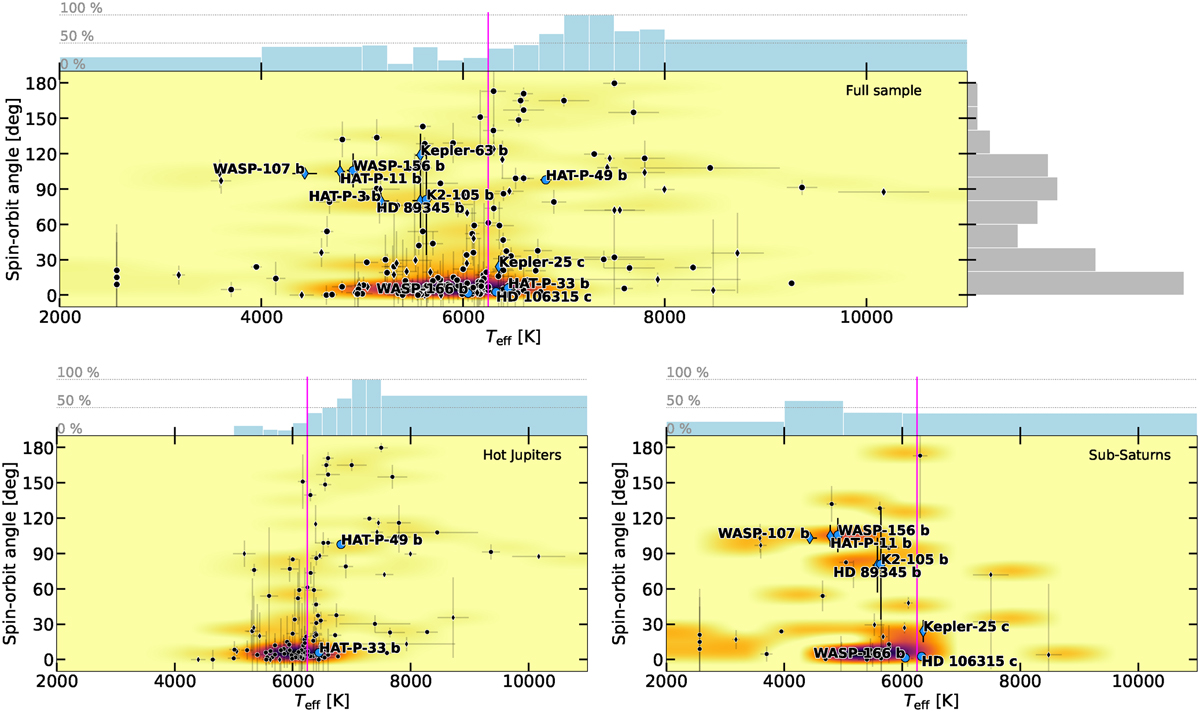
Distribution of spin–orbit angles as a function of the stellar effective temperature. Circles represent projected obliquities λ and diamonds true obliquities ψ. Exoplanets from the survey described in DREAM I are highlighted as blue symbols. The blue bars on top of the plots count the percentage of misaligned systems (λ or ψ > 30°) within each Teff bin. The top panel encompasses all systems with a known spin–orbit angle, whereas the bottom panels are subsets with only hot Jupiters (left) and sub-Saturns (right). The gray histogram on the right of the top plot counts the number of measurements within each spin–orbit angle bin. The color map represents a smoothed number-density of planets to guide the eye. The Kraft break (Teff = 6250 K) is shown as a magenta vertical line.
Current usage metrics show cumulative count of Article Views (full-text article views including HTML views, PDF and ePub downloads, according to the available data) and Abstracts Views on Vision4Press platform.
Data correspond to usage on the plateform after 2015. The current usage metrics is available 48-96 hours after online publication and is updated daily on week days.
Initial download of the metrics may take a while.