Fig. 4.
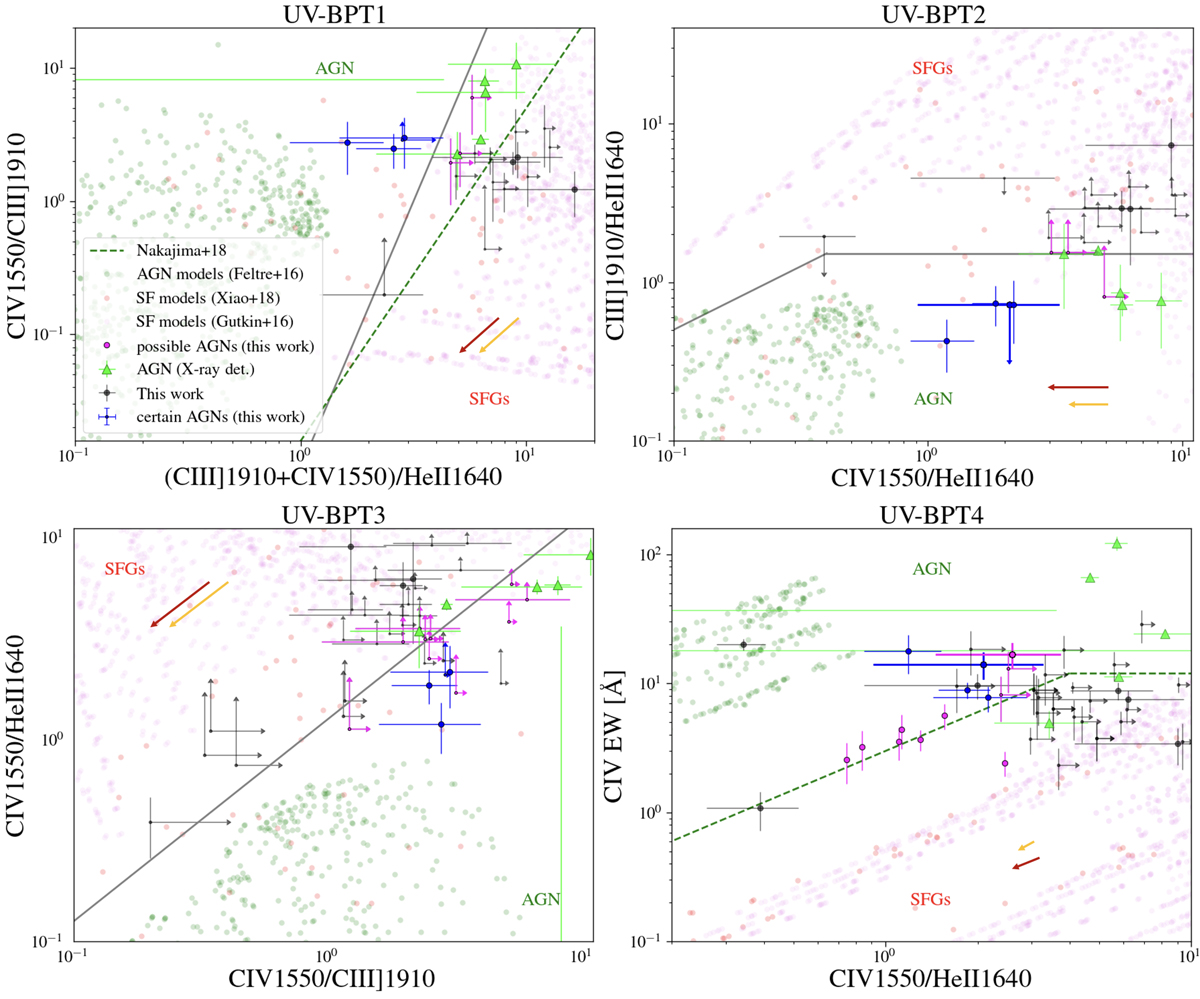
Download original image
UV diagnostic diagrams presenting photoionization models of AGN (dark green dots; Feltre et al. 2016) and SF galaxies (SFGs; red dots; Xiao et al. 2018; Gutkin et al. 2016). The separating lines consistently divide the two populations, and thus our sample of C IV emitters in: SF galaxies (black dots), confirmed AGNs (X-ray detected, in green), certain AGNs (blue dots) and possible AGNs (magenta), classified according to our criteria. The dashed green line division between ionization due to star formation alone and ionization due to AGN has been presented in Nakajima et al. (2018b). The grey solid line represents our best guess of the possible division between the two regions in all the UV-BPTs. We also plot two arrows indicating the displacement of the data points by imposing a stellar correction of 20% (red one) and 10% (orange one) for the C IV emission (based on Saxena et al. 2022a).
Current usage metrics show cumulative count of Article Views (full-text article views including HTML views, PDF and ePub downloads, according to the available data) and Abstracts Views on Vision4Press platform.
Data correspond to usage on the plateform after 2015. The current usage metrics is available 48-96 hours after online publication and is updated daily on week days.
Initial download of the metrics may take a while.