Fig. 8
Download original image
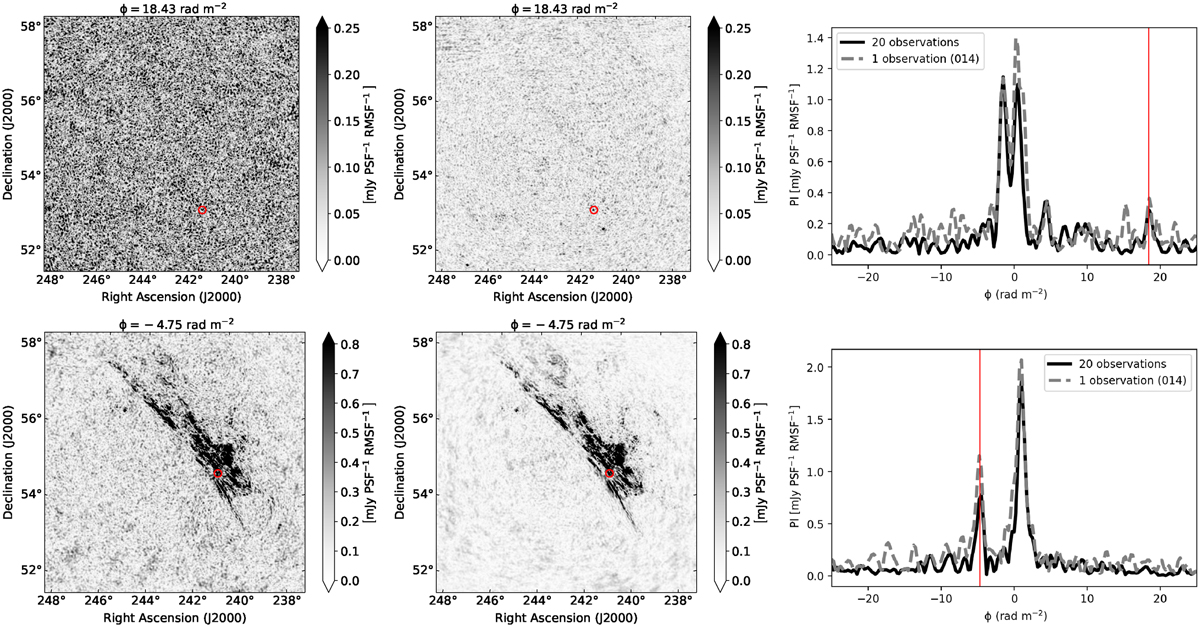
Example of a successful (upper panels) and an unsuccessful detection of a polarised source (lower panels) in the presented Faraday cubes (sources with ID 10 and 07 in Herrera Ruiz et al. 2021, respectively). Polarised intensity images in the reference (014, left images) and in the final stacked Faraday cube (middle images) are given at the closest available Faraday depth, such as that of the source. The location of the source in each image is marked with the red circle, while the corresponding Faraday spectra are given in plots on the right. A reported Faraday depth of the sources by Herrera Ruiz et al. (2021) are marked with vertical red lines.
Current usage metrics show cumulative count of Article Views (full-text article views including HTML views, PDF and ePub downloads, according to the available data) and Abstracts Views on Vision4Press platform.
Data correspond to usage on the plateform after 2015. The current usage metrics is available 48-96 hours after online publication and is updated daily on week days.
Initial download of the metrics may take a while.