Open Access
Fig. 7
Download original image
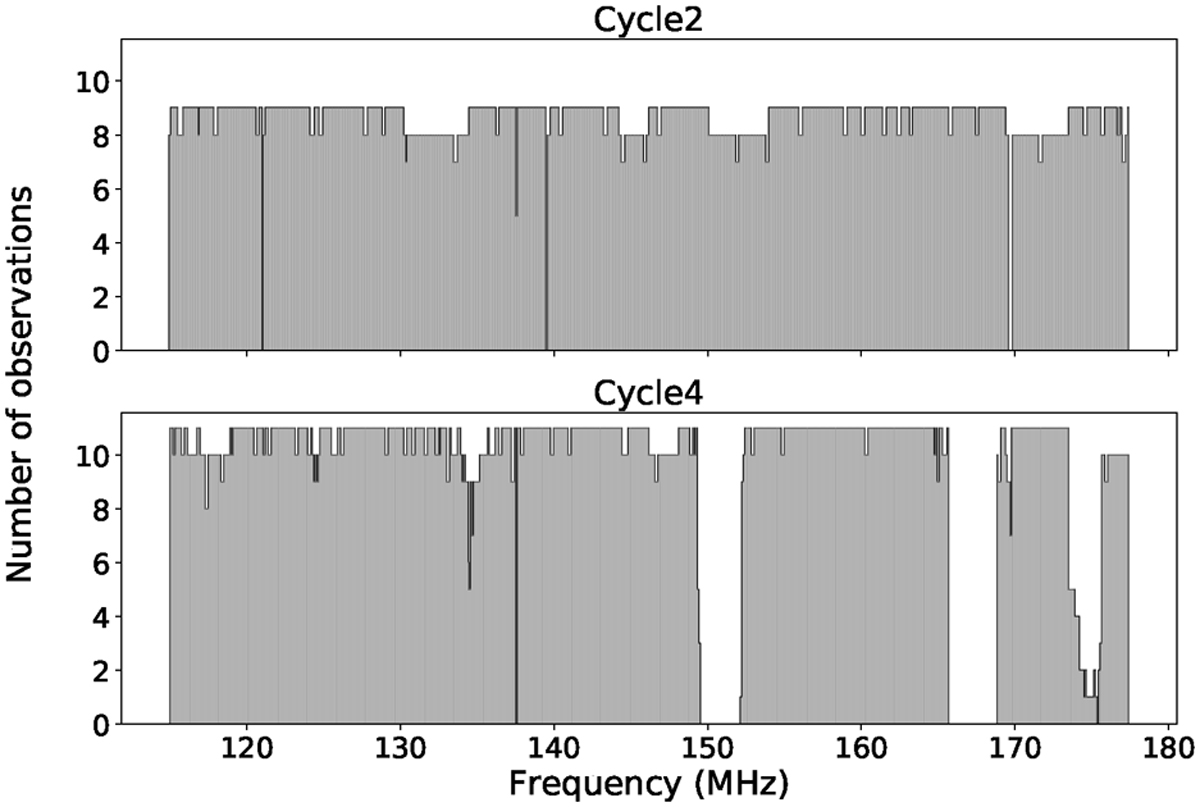
Number of observations per frequency channel used in the stacked data cube from Cycle 2 (upper plot) and Cycle 4 (lower plot) data. Although the data cover the same frequency range, they have different frequency configurations and hence a different number of frequency channels (see Sect. 2.1).
Current usage metrics show cumulative count of Article Views (full-text article views including HTML views, PDF and ePub downloads, according to the available data) and Abstracts Views on Vision4Press platform.
Data correspond to usage on the plateform after 2015. The current usage metrics is available 48-96 hours after online publication and is updated daily on week days.
Initial download of the metrics may take a while.