Fig. 6
Download original image
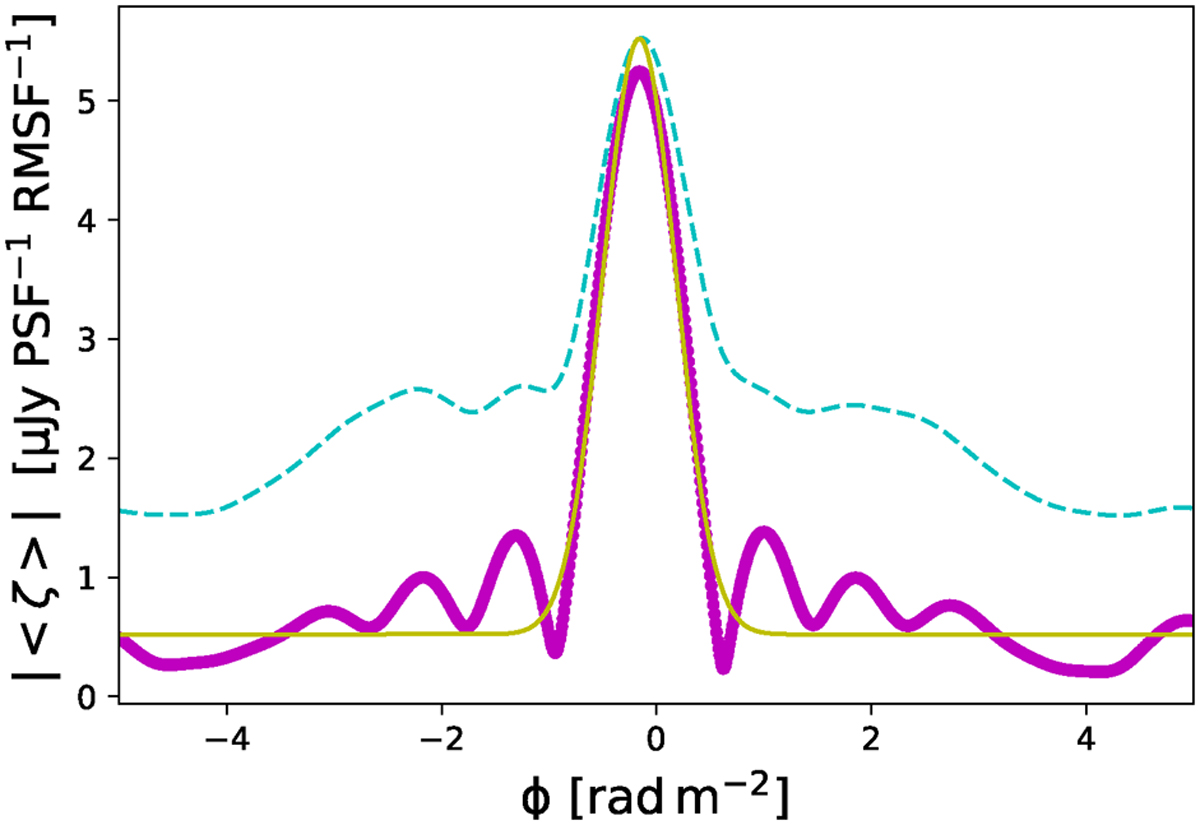
Calculated modulus of the averaged complex cross-correlation function for observations 009 and 014 (solid magenta line) and variations of the cross-correlation function across the Fov as measured by a standard deviation (dashed cyan line). A misalignment between two observations is determined by fitting a Gaussian to the peak (solid yellow line).
Current usage metrics show cumulative count of Article Views (full-text article views including HTML views, PDF and ePub downloads, according to the available data) and Abstracts Views on Vision4Press platform.
Data correspond to usage on the plateform after 2015. The current usage metrics is available 48-96 hours after online publication and is updated daily on week days.
Initial download of the metrics may take a while.