Fig. 5
Download original image
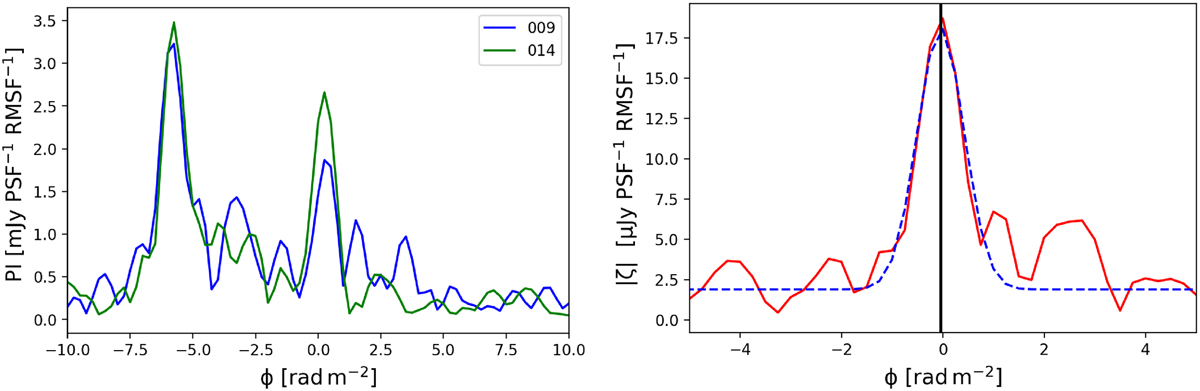
Example of a Faraday spectrum given in the polarised intensity for the 009 observation (blue line) and the reference (014) observation at a randomly chosen location marked with a blue circle in Fig. 4 (RA 242°18′03.60″ and Dec 56°08′16.80″), given on the left panel. Calculated modulus of the complex cross-correlation function |ζ| (red line) for the given Faraday spectra, fitted with a Gaussian (blue dashed line) to estimate the misalignment between the two observations (black vertical line) at this specific location, given on the right panel.
Current usage metrics show cumulative count of Article Views (full-text article views including HTML views, PDF and ePub downloads, according to the available data) and Abstracts Views on Vision4Press platform.
Data correspond to usage on the plateform after 2015. The current usage metrics is available 48-96 hours after online publication and is updated daily on week days.
Initial download of the metrics may take a while.