Fig. 4
Download original image
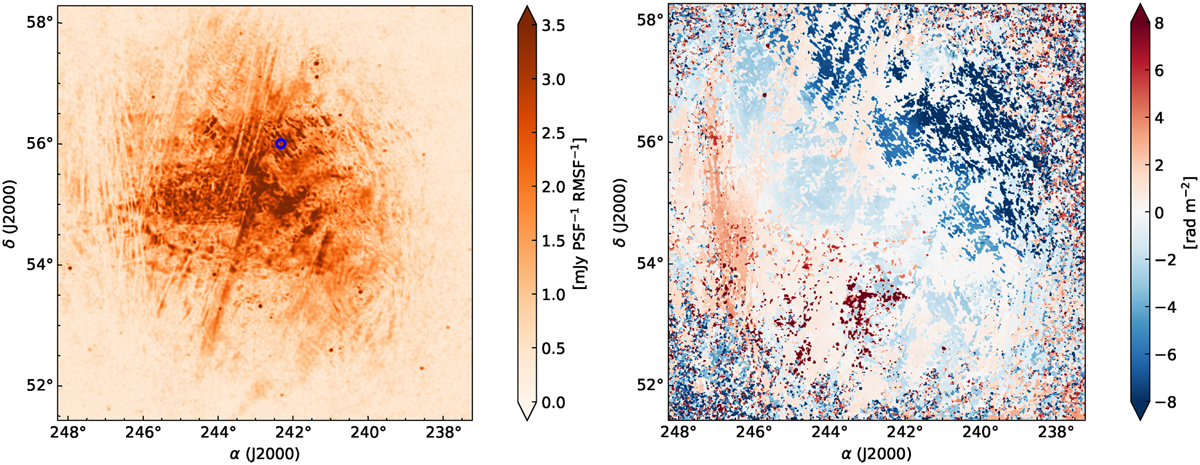
Image of the highest peak of the Faraday depth spectrum in the polarised intensity (left) and a corresponding image of a Faraday depth of the highest peak (right) for the observation with the lowest noise (014, the reference observation for Cycle 2). The blue circle in the left image marks a randomly chosen location for which a Faraday spectrum is presented in Fig. 5.
Current usage metrics show cumulative count of Article Views (full-text article views including HTML views, PDF and ePub downloads, according to the available data) and Abstracts Views on Vision4Press platform.
Data correspond to usage on the plateform after 2015. The current usage metrics is available 48-96 hours after online publication and is updated daily on week days.
Initial download of the metrics may take a while.