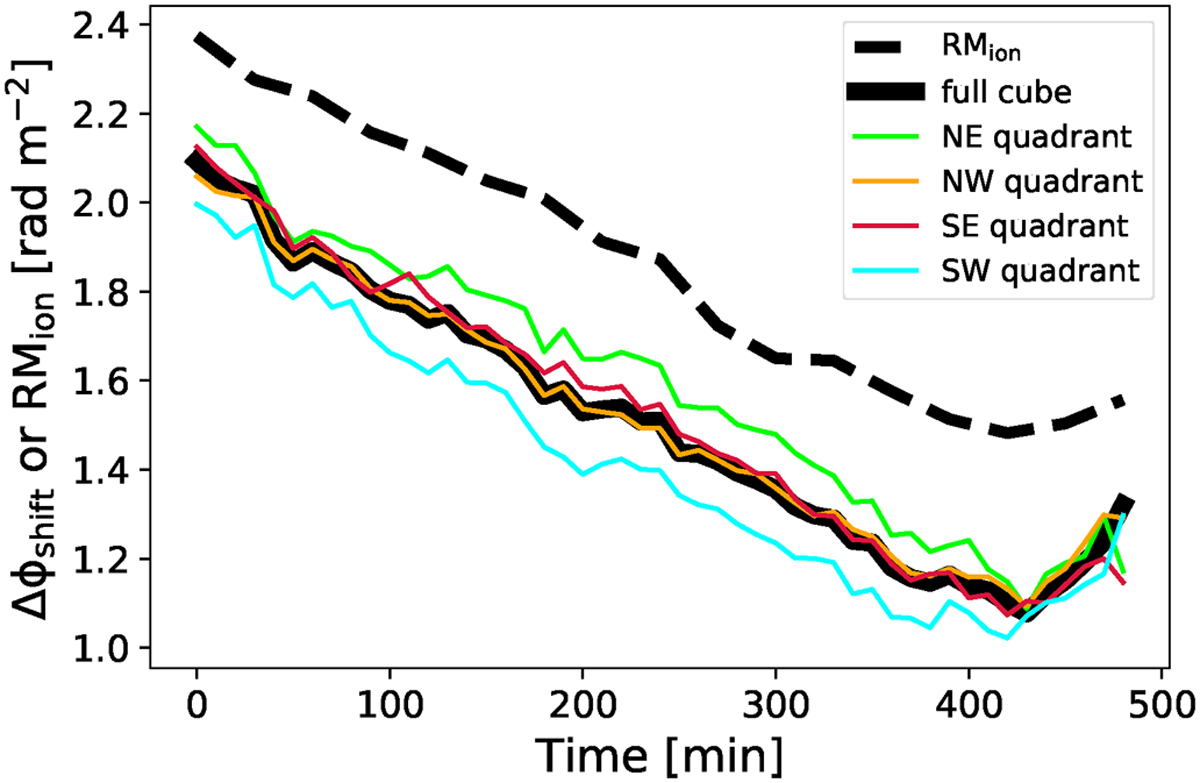
Fig. A.2
Download original image
Estimated relative shifts in Faraday depth (ΔФshift) of each ten-minute interval of the 011 observation with respect to the full eight-hour reference (014) observation (thick solid black line). The calculated RMion corrections based on the satellite TEC measurements are plotted with a thick dashed black line. The thin solid coloured lines give the ΔΦshift in the field-oſ-view quadrants.
Current usage metrics show cumulative count of Article Views (full-text article views including HTML views, PDF and ePub downloads, according to the available data) and Abstracts Views on Vision4Press platform.
Data correspond to usage on the plateform after 2015. The current usage metrics is available 48-96 hours after online publication and is updated daily on week days.
Initial download of the metrics may take a while.