Fig. 7.
Download original image
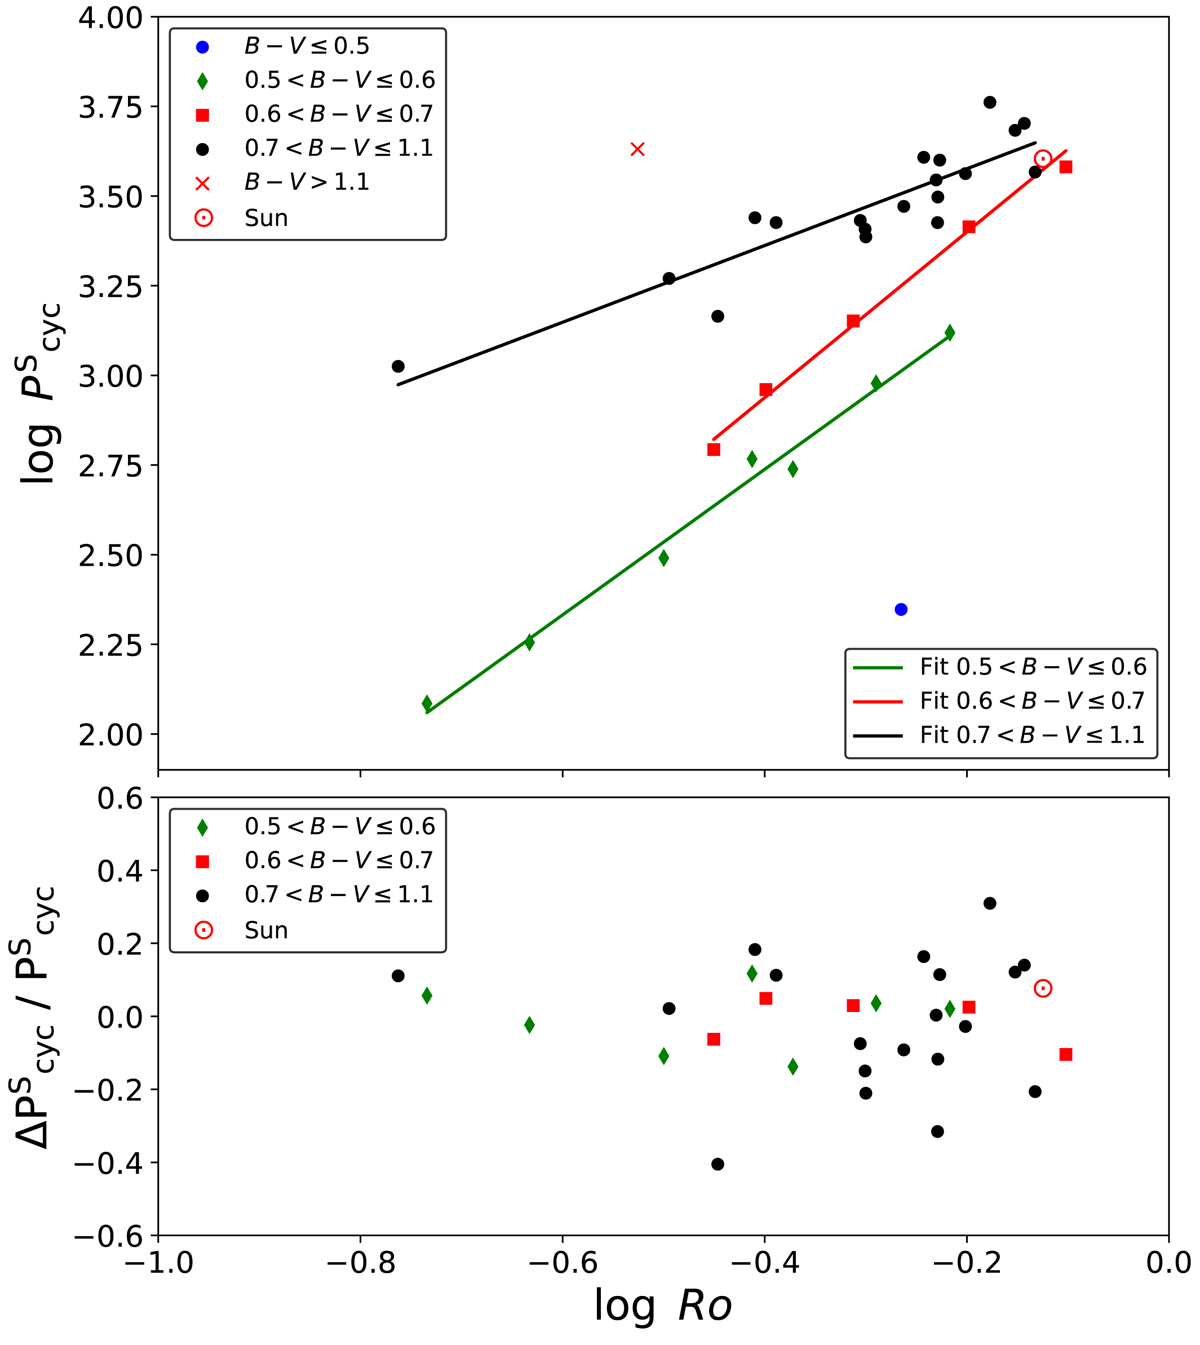
Logarithm of cycle periods on the short-cycle branch versus the logarithm of the Rossby number. Upper panel: Cycle period against Rossby number for cycles on the short-period (inactive) branch; different colours and symbols indicate the different B − V ranges. The solid-coloured lines show the respective empirical relations, with colours indicating the different B − V ranges. Lower panel: Relative deviation (![]() ) versus the logarithm of the Rossby number. The green points label the stars within the B − V range of 0.5 < B − V ≤ 0.6, the red points stars within 0.6 < B − V ≤ 0.7, and the black points those within 0.7 < B − V ≤ 1.1.
) versus the logarithm of the Rossby number. The green points label the stars within the B − V range of 0.5 < B − V ≤ 0.6, the red points stars within 0.6 < B − V ≤ 0.7, and the black points those within 0.7 < B − V ≤ 1.1.
Current usage metrics show cumulative count of Article Views (full-text article views including HTML views, PDF and ePub downloads, according to the available data) and Abstracts Views on Vision4Press platform.
Data correspond to usage on the plateform after 2015. The current usage metrics is available 48-96 hours after online publication and is updated daily on week days.
Initial download of the metrics may take a while.