Open Access
Fig. 5.
Download original image
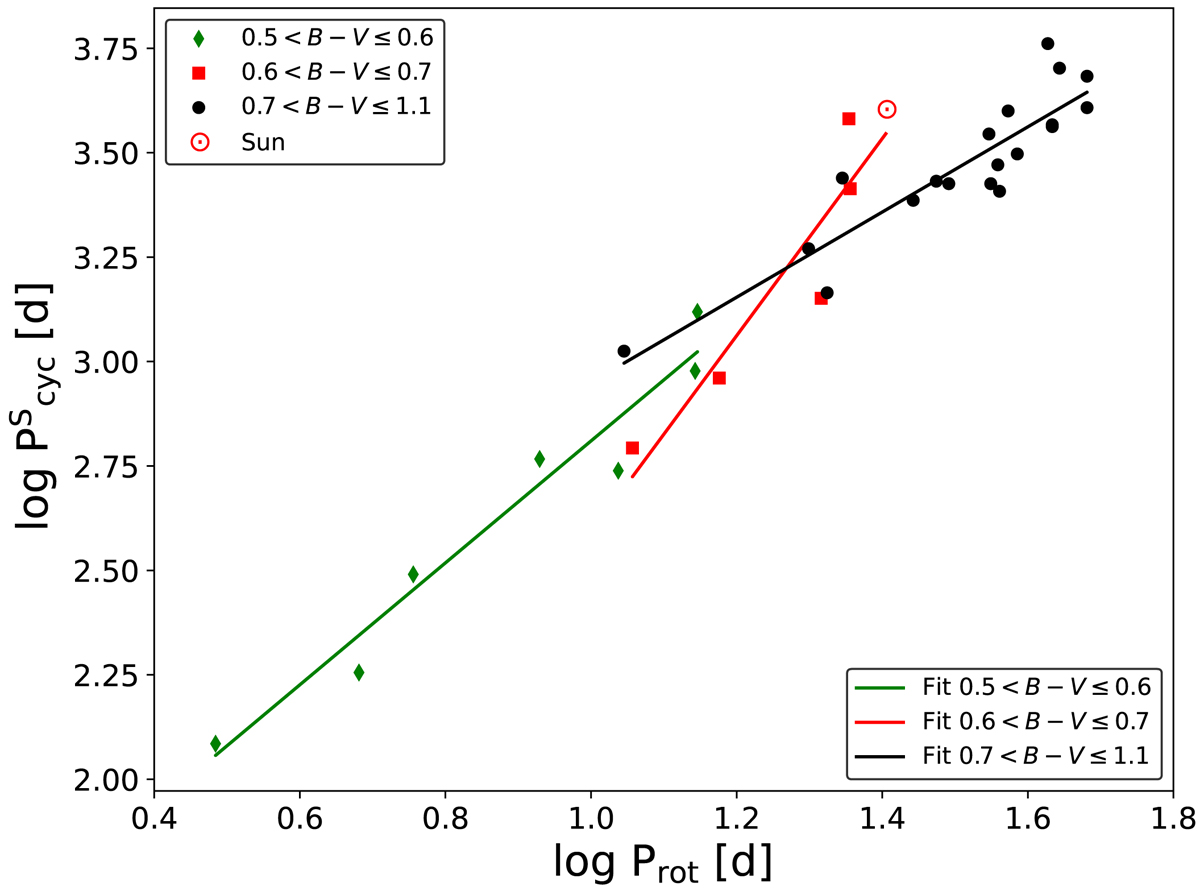
Logarithms of short-cycle branch periods are plotted over the logarithm of rotation period. Different B − V ranges are colour coded and the solid lines depict the estimated empirical relations of individual B − V ranges, which discussed in Sect. 4.2.2.
Current usage metrics show cumulative count of Article Views (full-text article views including HTML views, PDF and ePub downloads, according to the available data) and Abstracts Views on Vision4Press platform.
Data correspond to usage on the plateform after 2015. The current usage metrics is available 48-96 hours after online publication and is updated daily on week days.
Initial download of the metrics may take a while.