Fig. 4.
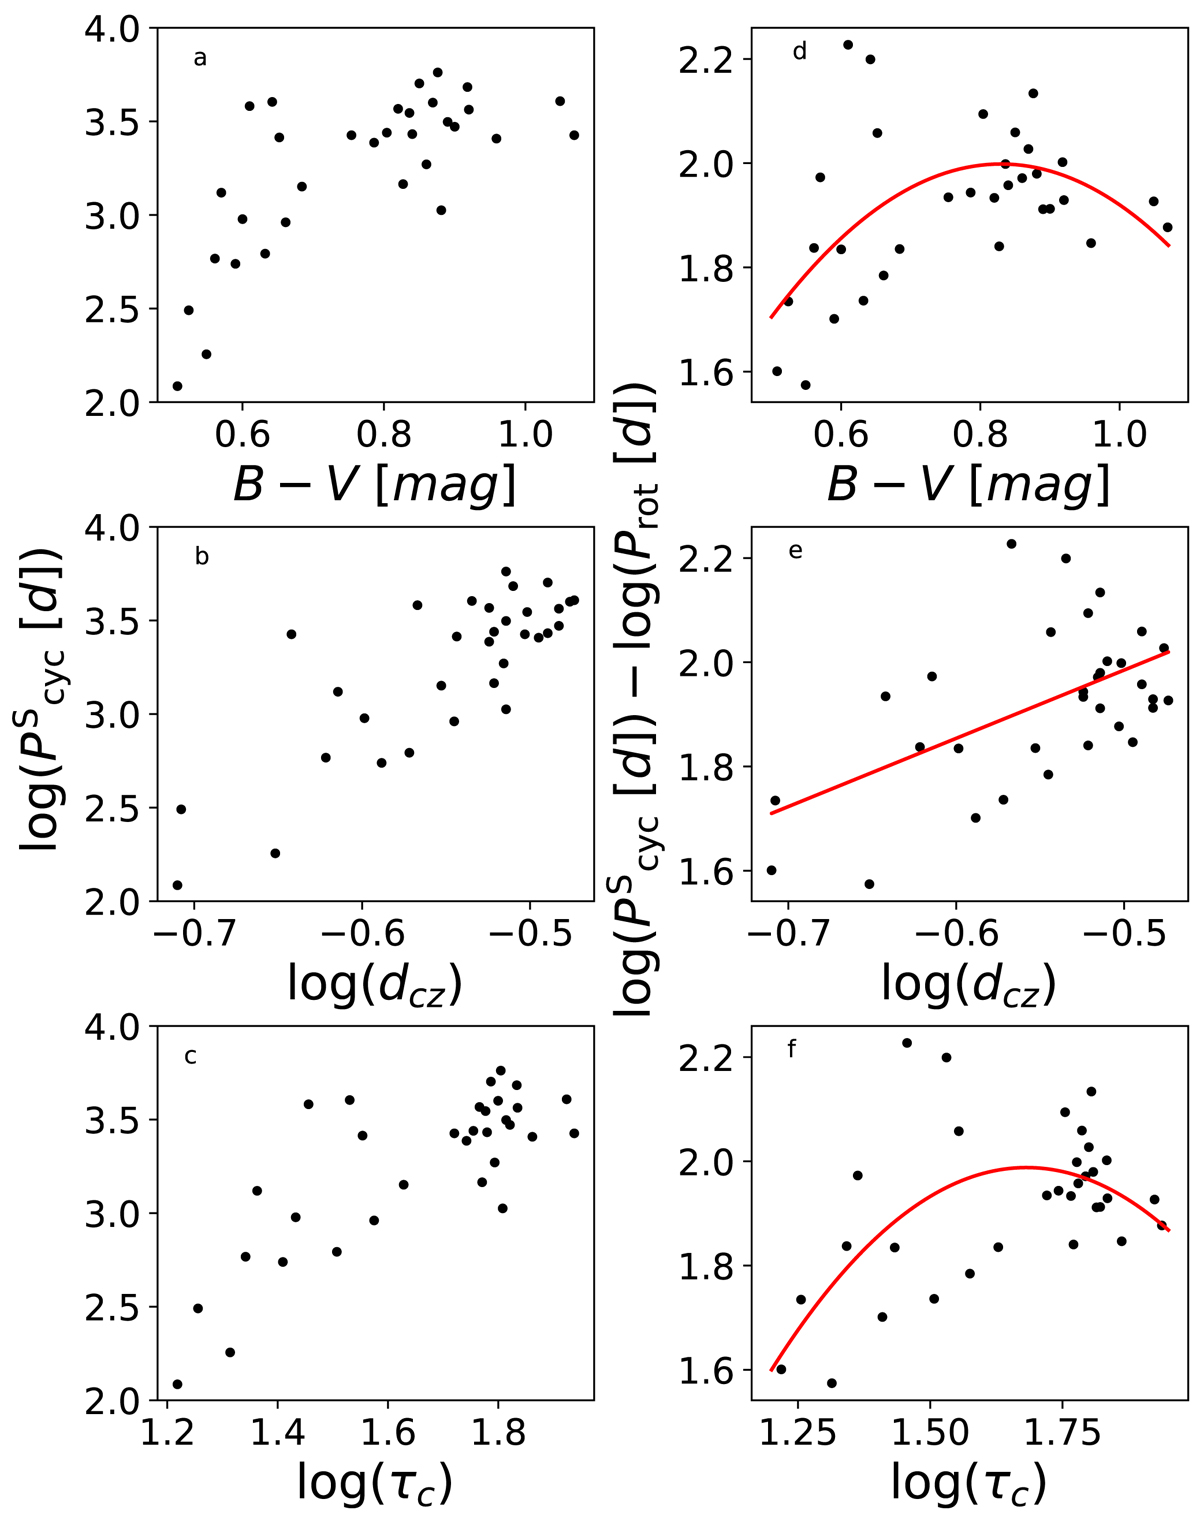
Download original image
Correlation between logarithm of the cycle period and the colour index B − V, relative depth of the convection zone and convective turnover time. Left panels: Logarithm of the cycle period versus the colour index B − V in panel a, versus the relative depth of the convection zone in panel b, and versus the convective turnover time in panel c. Right panels: Difference between the logarithm of the cycle period and the logarithm of the rotation period versus the colour index B − V is shown in panel d, versus the relative depth of the convection zone in panel e and the convective turnover time in panel f. The red solid line in panels d to e shows the estimated trend between both values; see text for details.
Current usage metrics show cumulative count of Article Views (full-text article views including HTML views, PDF and ePub downloads, according to the available data) and Abstracts Views on Vision4Press platform.
Data correspond to usage on the plateform after 2015. The current usage metrics is available 48-96 hours after online publication and is updated daily on week days.
Initial download of the metrics may take a while.