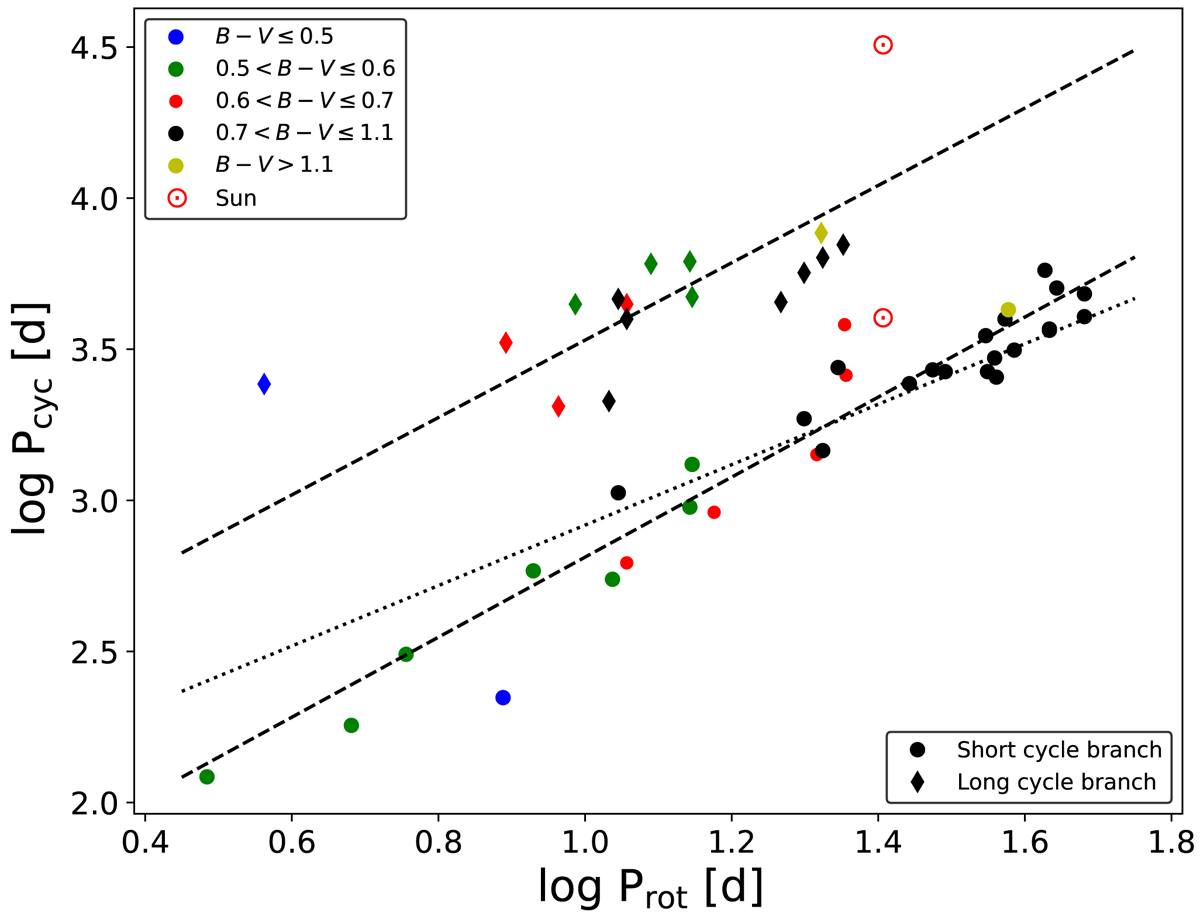
Fig. 1.
Download original image
Logarithms of cycle period versus logarithms of rotation period for the sample stars. Here, the two branches are labelled with different signs and the different B − V ranges are colour-coded. Furthermore, the dashed lines are depicted the estimated trends in the range 0.5 ≤ B − V ≤ 1.1 of the cycle-rotation relations in both branches and the dotted line represents the trend with a fixed slope 1 for the short-cycle branch.
Current usage metrics show cumulative count of Article Views (full-text article views including HTML views, PDF and ePub downloads, according to the available data) and Abstracts Views on Vision4Press platform.
Data correspond to usage on the plateform after 2015. The current usage metrics is available 48-96 hours after online publication and is updated daily on week days.
Initial download of the metrics may take a while.