Open Access
Fig. 9
Download original image
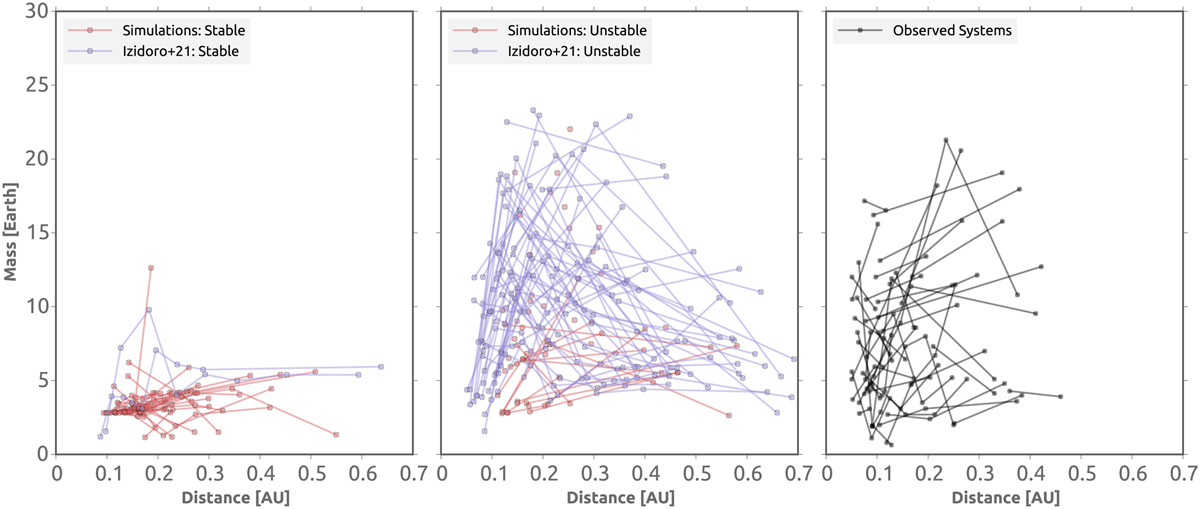
Planetary masses and semi-major axis of all our systems after 100 Myr of integration that remain stable (left) or became unstable (middle). We over plot also the data from Izidoro et al. (2021b) as well as from observations (right). The lines between the dots mark planets within the same system.
Current usage metrics show cumulative count of Article Views (full-text article views including HTML views, PDF and ePub downloads, according to the available data) and Abstracts Views on Vision4Press platform.
Data correspond to usage on the plateform after 2015. The current usage metrics is available 48-96 hours after online publication and is updated daily on week days.
Initial download of the metrics may take a while.