Fig. 2
Download original image
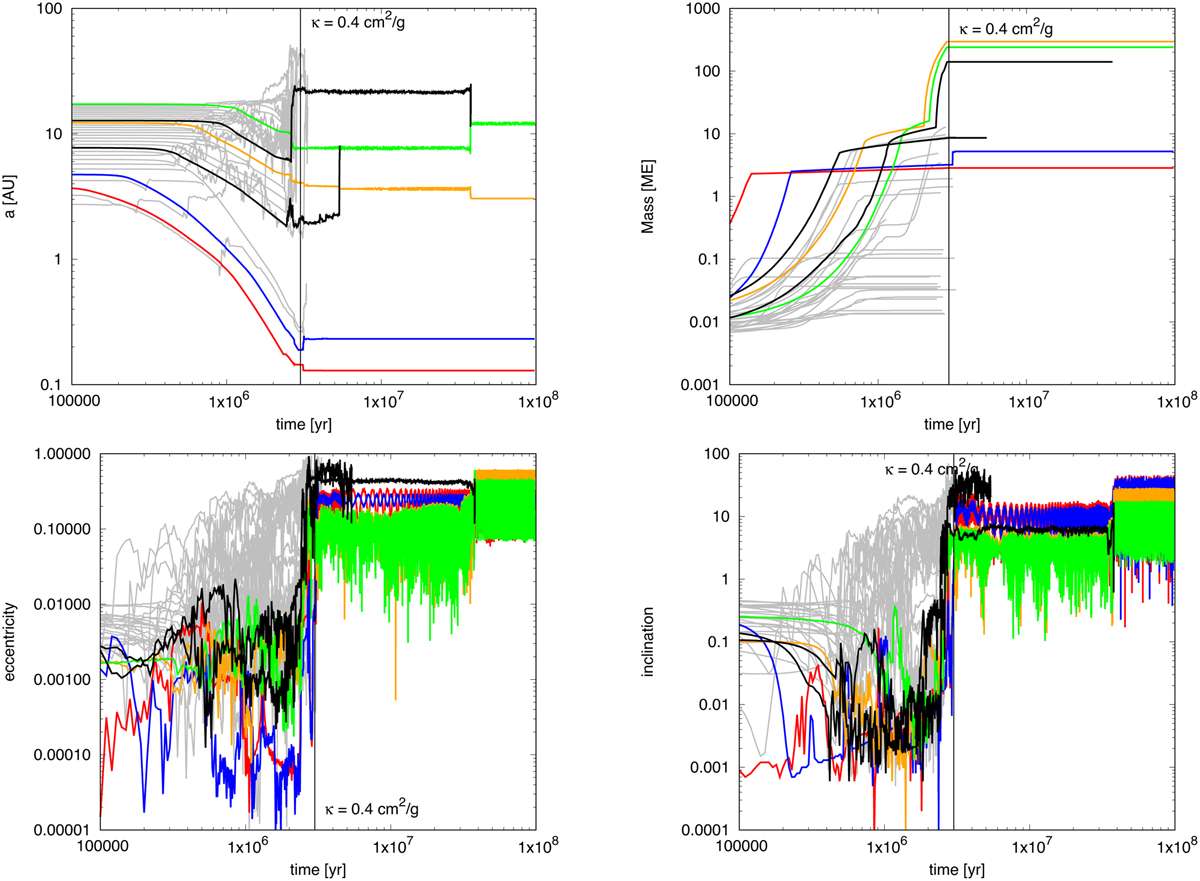
Evolution of a system with an envelope opacity of κ = 0.4 cm2 g−1 and Speb = 5.0. Semi major axis (top left), planetary mass (top right), eccentricity (bottom left) and inclination (bottom right) of the 30 planetary embryos are plotted as function of time, where we omit the first 100 kyr for clarity. The gas-disk lifetime is 3 Myr after injection of the planetary embryos, where the end of the gas-disk lifetime is marked by the vertical black line. The gray lines represent either small mass bodies, or bodies that are ejected during the lifetime of the gas disk. The black lines represent massive planets that are scattered away after the gas-disk phase. The colored lines represent the four surviving planets.
Current usage metrics show cumulative count of Article Views (full-text article views including HTML views, PDF and ePub downloads, according to the available data) and Abstracts Views on Vision4Press platform.
Data correspond to usage on the plateform after 2015. The current usage metrics is available 48-96 hours after online publication and is updated daily on week days.
Initial download of the metrics may take a while.