Fig. 11
Download original image
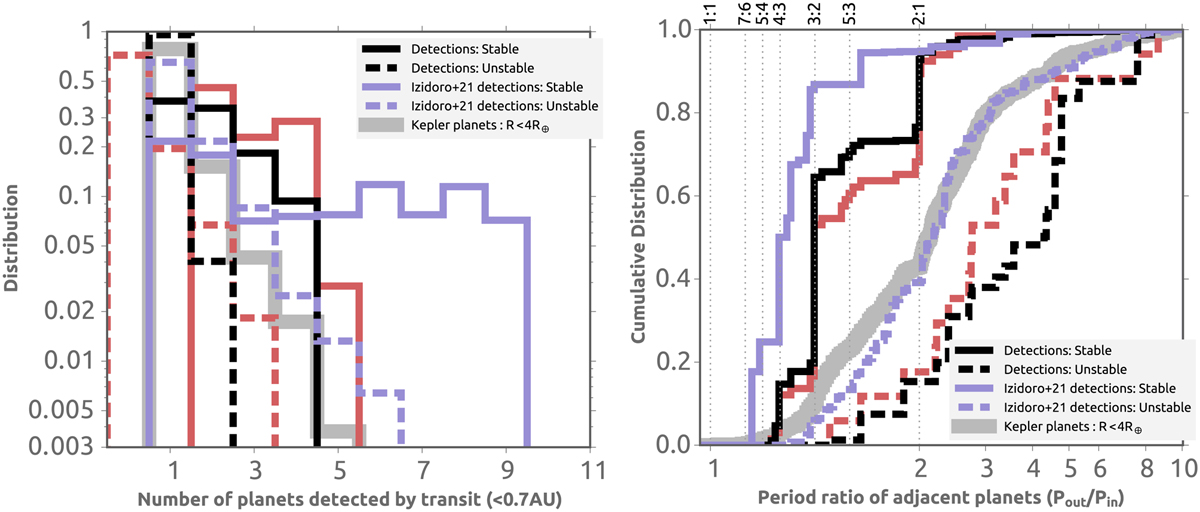
Synthetic observations of the planets formed in our simulations. Left: number of synthetically observed planets in each system divided by stable and nonstable systems (black) and their corresponding real number of planets (red). We also over plot the synthetically observed planets from the simulations of Izidoro et al. (2021b) in purple. We do not included N = 0 for our synthetic observations. Right: observed period ratios of synthetically observed planetary pairs, divided by stable and unstable systems using the same color coding.
Current usage metrics show cumulative count of Article Views (full-text article views including HTML views, PDF and ePub downloads, according to the available data) and Abstracts Views on Vision4Press platform.
Data correspond to usage on the plateform after 2015. The current usage metrics is available 48-96 hours after online publication and is updated daily on week days.
Initial download of the metrics may take a while.