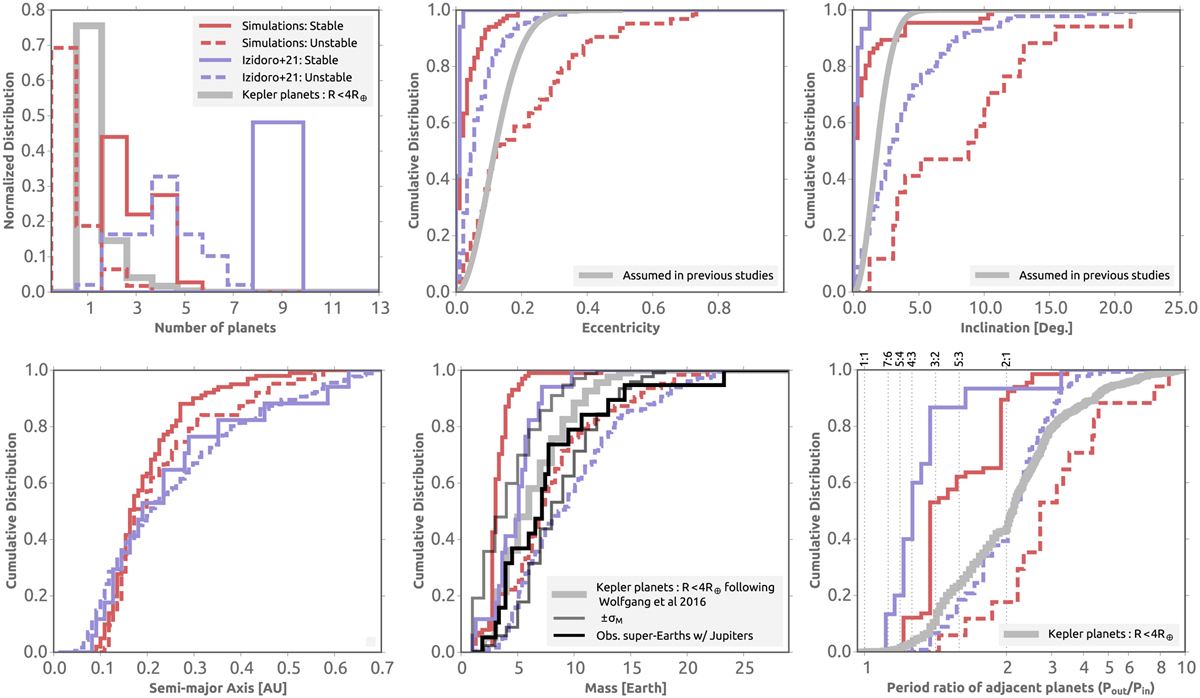
Fig. 10
Download original image
Number of planets (top left), their eccentricity distribution (top middle), their inclination distribution (top right), their semi-major axis distribution (bottom left), their mass distribution (bottom middle) as well as the period ratio of adjacent planets from our simulations as well as from the simulations of Izidoro et al. (2021b) divided into the stable and unstable samples. The gray lines mark the constraints from the Kepler observations.
Current usage metrics show cumulative count of Article Views (full-text article views including HTML views, PDF and ePub downloads, according to the available data) and Abstracts Views on Vision4Press platform.
Data correspond to usage on the plateform after 2015. The current usage metrics is available 48-96 hours after online publication and is updated daily on week days.
Initial download of the metrics may take a while.