Fig. 9
Download original image
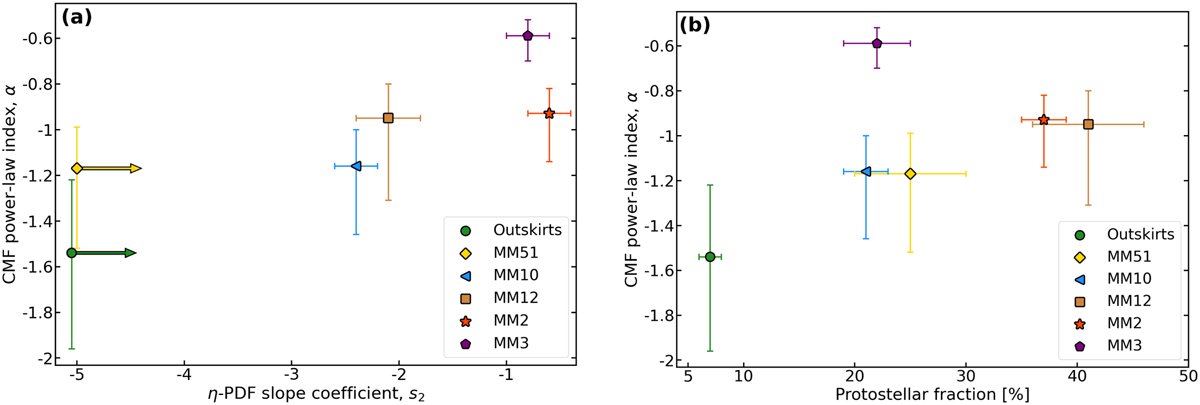
For each W43-MM2&MM3 subregion, the power-law index of the CMF high-mass end plotted against the slope coefficient of the second η-PDF tail (panel a) and the protostellar fraction (panel b). Horizontal arrows represent lower limits for s2 in panel a. We avoid fitting the correlation trends observed in panels a–b because they rely on too few subregions.
Current usage metrics show cumulative count of Article Views (full-text article views including HTML views, PDF and ePub downloads, according to the available data) and Abstracts Views on Vision4Press platform.
Data correspond to usage on the plateform after 2015. The current usage metrics is available 48-96 hours after online publication and is updated daily on week days.
Initial download of the metrics may take a while.