Fig. 8
Download original image
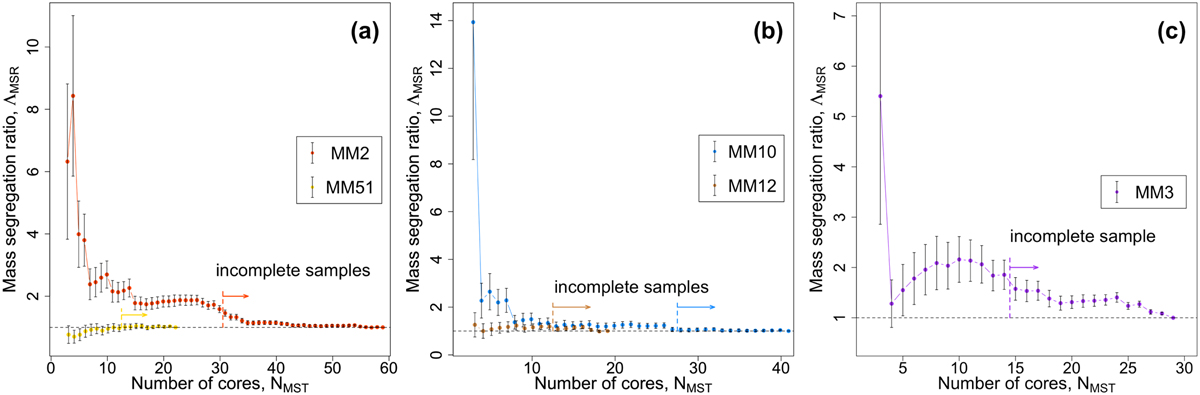
Mass segregation ratio of cores in the W43-MM2&MM3 subregions. Computed from Eq. (7), they are measured in the MM2 and MM51 subregions (panel a), in MM10 and MM12 (panel b), and in MM3 (panel c). Error bars are the ±1σ uncertainties. Right arrows and vertical dashed lines locate the 90% completeness levels of the subregion catalogs of cores (see Table 2). Values well above Λmsr ≃ 1 (dashed black horizontal line) strongly suggest mass segregation in MM2, MM3, and MM10 (see Table 3).
Current usage metrics show cumulative count of Article Views (full-text article views including HTML views, PDF and ePub downloads, according to the available data) and Abstracts Views on Vision4Press platform.
Data correspond to usage on the plateform after 2015. The current usage metrics is available 48-96 hours after online publication and is updated daily on week days.
Initial download of the metrics may take a while.