Fig. 7
Download original image
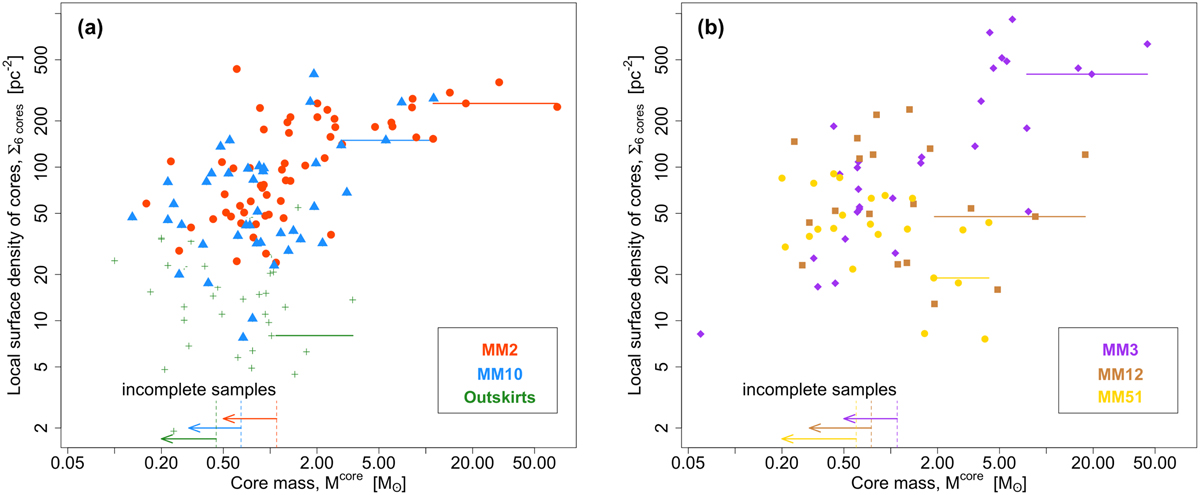
Local surface density of cores as a function of their core mass, for the MM2, MM10, and Outskirts subregions (panel a) and for the MM3, MM12, and MM51 subregions (panel b). Horizontal segments indicate the local surface densities of the five most massive cores, (Σ6 cores)massive, in the subregion. Left arrows and vertical dashed segments locate the 90% completeness level of each core catalog (see Table 2). The five most massive cores of MM2, MM3, and MM10 have higher core local surface densities of cores than the median densities measured for their entire core sample (see Table 3).
Current usage metrics show cumulative count of Article Views (full-text article views including HTML views, PDF and ePub downloads, according to the available data) and Abstracts Views on Vision4Press platform.
Data correspond to usage on the plateform after 2015. The current usage metrics is available 48-96 hours after online publication and is updated daily on week days.
Initial download of the metrics may take a while.