Fig. 6
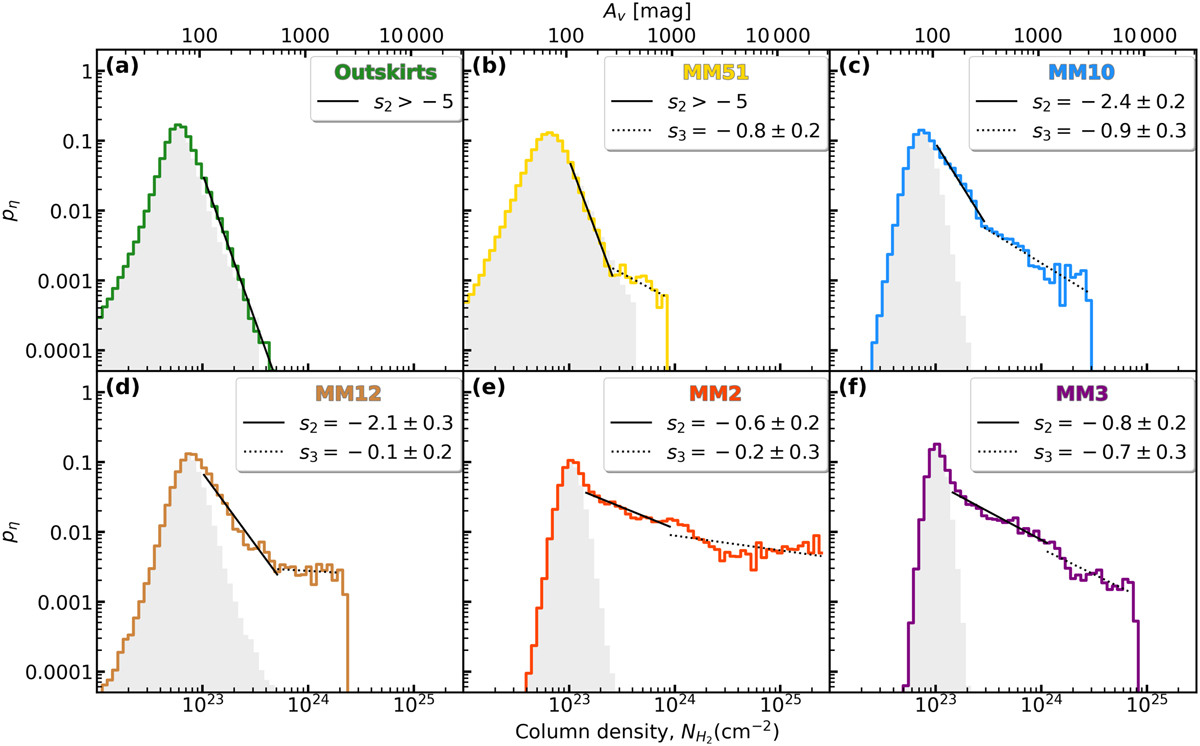
Download original image
ALMA η-PDFs of the W43-MM2&MM3 subregions (colored histograms), whose high-column-density tail is fitted by the two power laws s2 and s3 (solid and dotted black segments, respectively) above the ascending part of their histogram, which we have symmetrized with respect to the peak (gray-shaded histogram; see Sect. 3.2). While the third tail is dominated by pixels at the cores’ position, the second tail corresponds to the immediate surroundings of the cores (see Fig. A.1). The MM2 and MM3 subregions have flatter second tails, a clearer continuity between their second and third tails, and reach much higher column densities in their third tails than the other subregions (panels e−f). Uncertainties on the power-law indices account for uncertainties on the binning, fit ranges, and column density offset (see Sect. 3.2).
Current usage metrics show cumulative count of Article Views (full-text article views including HTML views, PDF and ePub downloads, according to the available data) and Abstracts Views on Vision4Press platform.
Data correspond to usage on the plateform after 2015. The current usage metrics is available 48-96 hours after online publication and is updated daily on week days.
Initial download of the metrics may take a while.