Fig. 5
Download original image
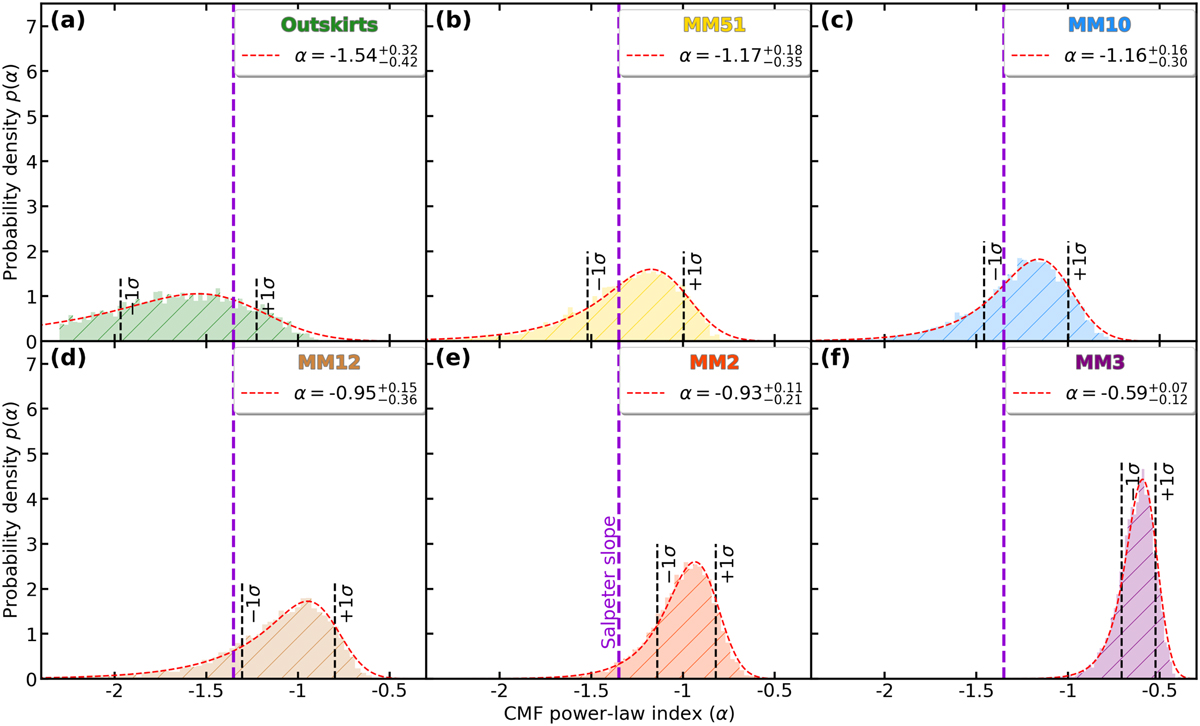
Determination of the index and uncertainty of the power law fitted to the high-mass end of the cumulative CMF observed for the six W43-MM2&MM3 subregions (panels a–f). Each bootstrapping probability density function (colored and hatched histogram) is built from 5000 slopes fitted by a MLE method for data sets generated from a random draw with discount of the subregion core sample. This bootstrap procedure quantifies the effect of small-number statistics on α and its uncertainty and also includes uncertainties on the core mass and catalog completeness level (see Sect. 3.1.1). The dashed red curves represent the EMGs with negative skewness, which are fitted to the histograms. Power-law indices, α, are taken to be values at the EMG peaks; their asymmetric uncertainties are estimated from the −1σ and +1σ standard deviations of the EMG (dashed vertical segments). The high-mass end of the canonical IMF, which has a power-law index of αIMF = −1.35 (dashed magenta lines; Salpeter 1955), is shown for comparison.
Current usage metrics show cumulative count of Article Views (full-text article views including HTML views, PDF and ePub downloads, according to the available data) and Abstracts Views on Vision4Press platform.
Data correspond to usage on the plateform after 2015. The current usage metrics is available 48-96 hours after online publication and is updated daily on week days.
Initial download of the metrics may take a while.