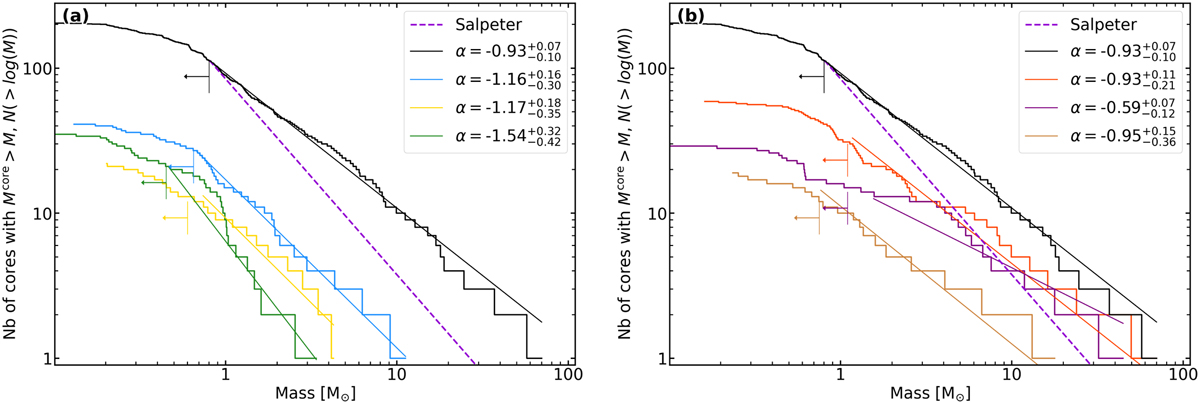
Fig. 4
Download original image
CMFs of the W43-MM2&MM3 subregions, plotted in their cumulative form, with shapes at the high-mass end varying from steeper than or close to the Salpeter slope of the canonical IMF (MM10, MM51 and Outskirts; light blue, yellow and green histograms of panel a) to top-heavy (MM2, MM3 and MM12; red, violet and brown histogram s of panel b). CMFs (colored histograms) are fitted by single power laws of the form N(> log (M)) ∝ Mα (lines), above the associated 990% completeness limits (left arrows and vertical lines; see Table 2) and using a bootstrapping method that use s a MLE method (see Sect. 3.1.2). The high-mass end of the canonical IMF, which has a power-law indexe of αIMF = −1.35 (dashed imgenta lines; Salpeter 1955), is shown for comparison. The top-heavy CMF of the W43-MM2&MM3 ridge (black histogram) mostly originates from that of the MM2 subregion. The MM3 CMF is complex, being both top-heavy and bottom-light.
Current usage metrics show cumulative count of Article Views (full-text article views including HTML views, PDF and ePub downloads, according to the available data) and Abstracts Views on Vision4Press platform.
Data correspond to usage on the plateform after 2015. The current usage metrics is available 48-96 hours after online publication and is updated daily on week days.
Initial download of the metrics may take a while.