Fig. A.3
Download original image
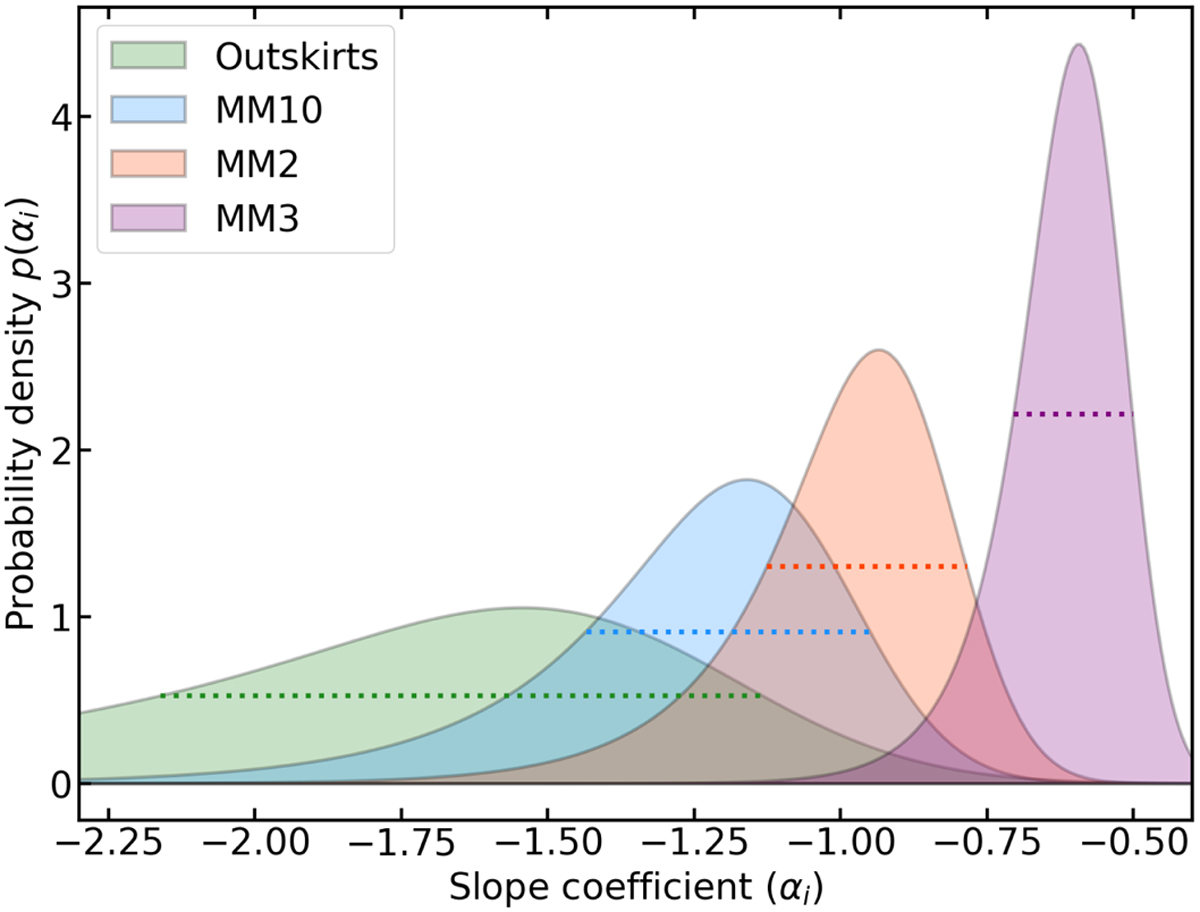
Bootstrapping probability density functions of the power-law indices measured for the CMF high-mass end of the MM2, MM3, MM10, and Outskirts subregions. Each distribution is fitted by an EMG with negative skewness. According to their 1σ width (dotted segments), subregions appear distinct, except for MM10, whose highest probability part of the bootstrapping distribution overlaps with both the MM2 and Outskirts subregions.
Current usage metrics show cumulative count of Article Views (full-text article views including HTML views, PDF and ePub downloads, according to the available data) and Abstracts Views on Vision4Press platform.
Data correspond to usage on the plateform after 2015. The current usage metrics is available 48-96 hours after online publication and is updated daily on week days.
Initial download of the metrics may take a while.