Fig. A.1
Download original image
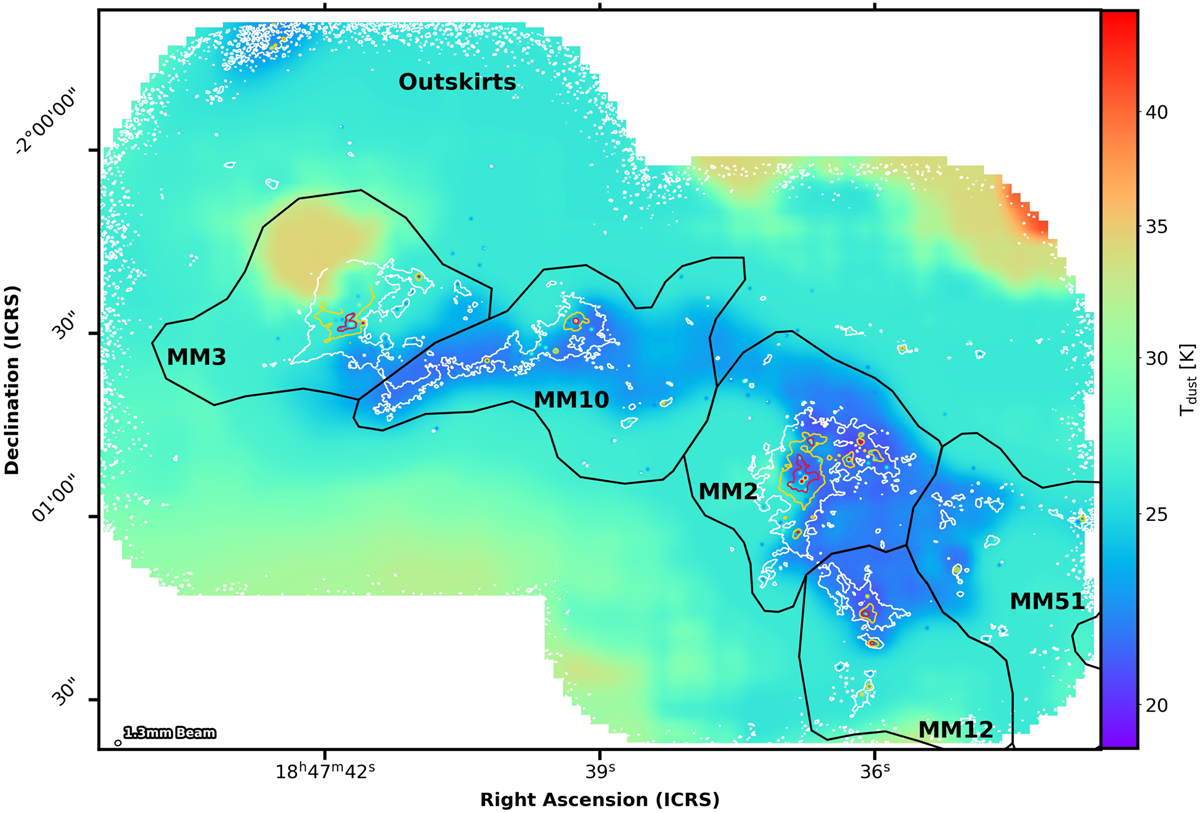
Dust temperature image of the W43-MM2&MM3 protocluster cloud, taken from Pouteau et al. (2022). It combines a 2.5″ resolution dust temperature image computed from a Bayesian spectral energy distribution fit for fluxes ranging from 70 µm to 3 mm (see Dell’Ova et al. in prep.) with the central heating and self-shielding of protostellar and pre-stellar cores, respectively, at 0.46″ resolution (see Sect. 4.2 of Pouteau et al. 2022, for more details). White, orange, and red contours correspond to the ![]() levels defined in Figs. 1b–c. Black polygons indicate the subregions defined in Section 2.2, and the ellipse in the bottom-left corner corresponds to the 1.3 mm beam.
levels defined in Figs. 1b–c. Black polygons indicate the subregions defined in Section 2.2, and the ellipse in the bottom-left corner corresponds to the 1.3 mm beam.
Current usage metrics show cumulative count of Article Views (full-text article views including HTML views, PDF and ePub downloads, according to the available data) and Abstracts Views on Vision4Press platform.
Data correspond to usage on the plateform after 2015. The current usage metrics is available 48-96 hours after online publication and is updated daily on week days.
Initial download of the metrics may take a while.