Fig. 10
Download original image
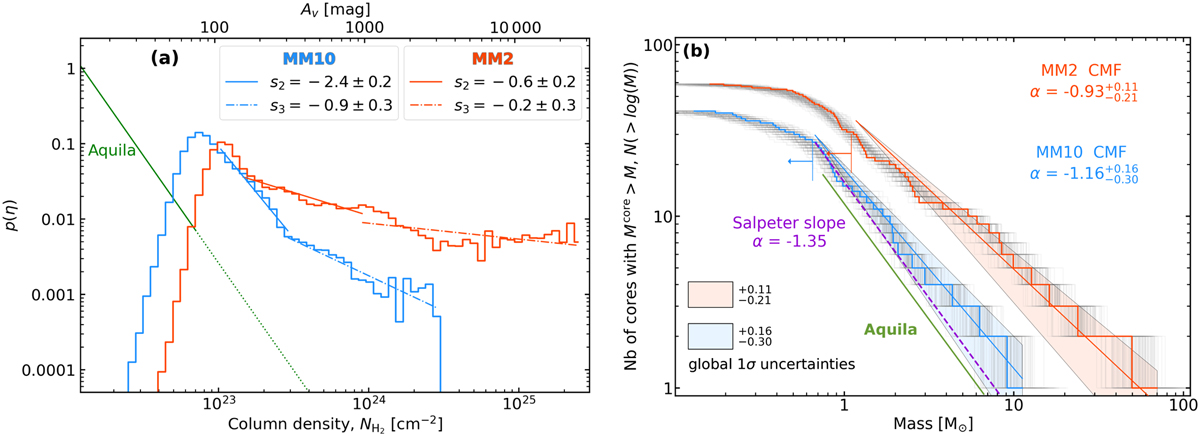
Two prototypical subregions of W43-MM2&MM3, MM2 (red line), and MM10 (blue line), compared with Aquila (green line). Panel a: η-PDF histograms, whose tails (colored segments) are fitted with power laws. Solid and dotted green lines correspond to the observed and extrapolated column density ranges from Könyves et al. (2015). While the η-PDF of the MM2 subregion displays a flat power-law tail, those of MM10 and Aquila are much steeper. Panel b: cumulative CMF histograms, whose high-mass ends are represented by power laws (colored segments) and their 1σ- global uncertainties (colored areas; see the definition in Sect. 3.1.2). While the MM2 subregion exhibits a top-heavy CMF, MM10 and Aquila have steeper (CMF high-mass ends, with power-law indices close to the Salpeter slope (dashed magenta line).
Current usage metrics show cumulative count of Article Views (full-text article views including HTML views, PDF and ePub downloads, according to the available data) and Abstracts Views on Vision4Press platform.
Data correspond to usage on the plateform after 2015. The current usage metrics is available 48-96 hours after online publication and is updated daily on week days.
Initial download of the metrics may take a while.