Fig. 1
Download original image
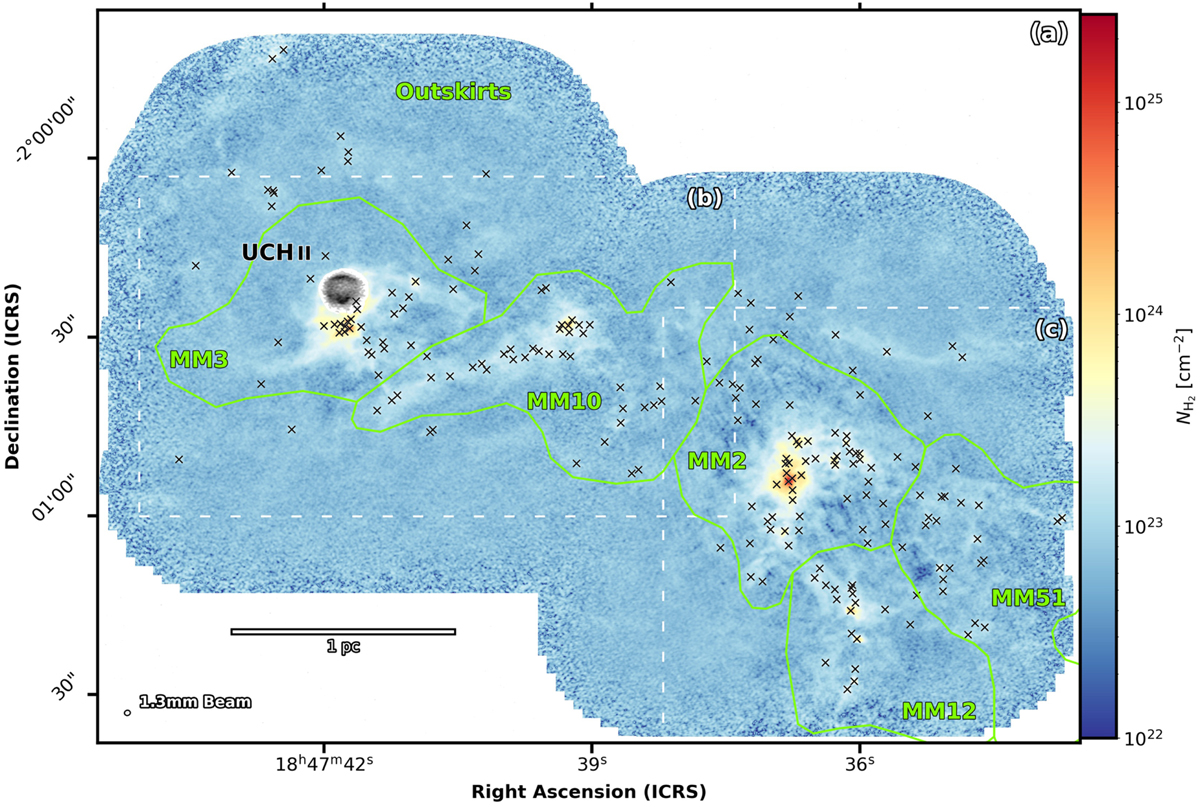
W43-MM2&MM3 mini-starburst ridge traced by its column density (color scale), derived from the ALMA 1.3 mm continuum image of Pouteau et al. (2022). It hosts a rich cluster of 205 cores (gray crosses), as reported by Pouteau et al. (2022), and the UCHII region W43-MM3, which is traced by its H41α emission line (Galván-Madrid et al., in prep.; gray scale) and where the column density is not computed. Green polygons outline the W43-MM2&MM3 subregions defined in Sect. 2.2. The ellipse in the lower-left corner indicates the 0.46″ angular resolution of the column density image, while the scale bar indicates the length scale at a distance of 5.5 kpc. Panel a: dashed white boxes outline the zoomed-in views shown in panels b–c.
Current usage metrics show cumulative count of Article Views (full-text article views including HTML views, PDF and ePub downloads, according to the available data) and Abstracts Views on Vision4Press platform.
Data correspond to usage on the plateform after 2015. The current usage metrics is available 48-96 hours after online publication and is updated daily on week days.
Initial download of the metrics may take a while.