Fig. B.3
Download original image
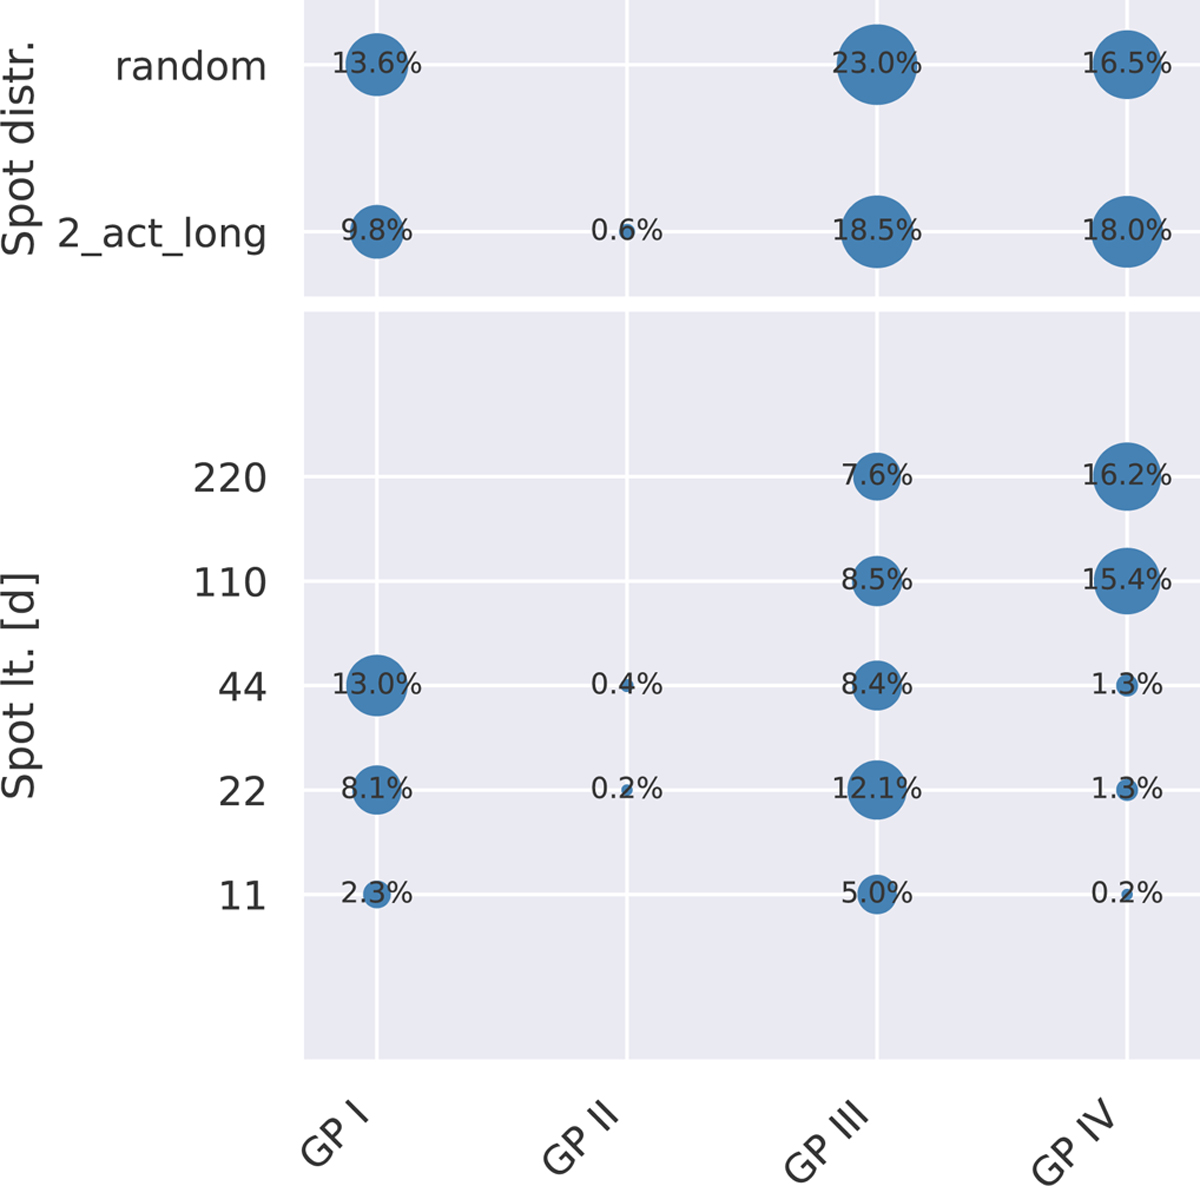
Single-model comparison of activity-only data. Shown is the breakdown to the individual GP priors for the significant or moderately favored GP models from Fig. B.1. Note that this is only a qualitative comparison based on the highest evidence compared to the best non-GP model. The percentages, also indicated by the point sizes, sum up to 100% for each configuration parameter category highlighted by the gray-shaded areas.
Current usage metrics show cumulative count of Article Views (full-text article views including HTML views, PDF and ePub downloads, according to the available data) and Abstracts Views on Vision4Press platform.
Data correspond to usage on the plateform after 2015. The current usage metrics is available 48-96 hours after online publication and is updated daily on week days.
Initial download of the metrics may take a while.