Open Access
Fig. B.2
Download original image
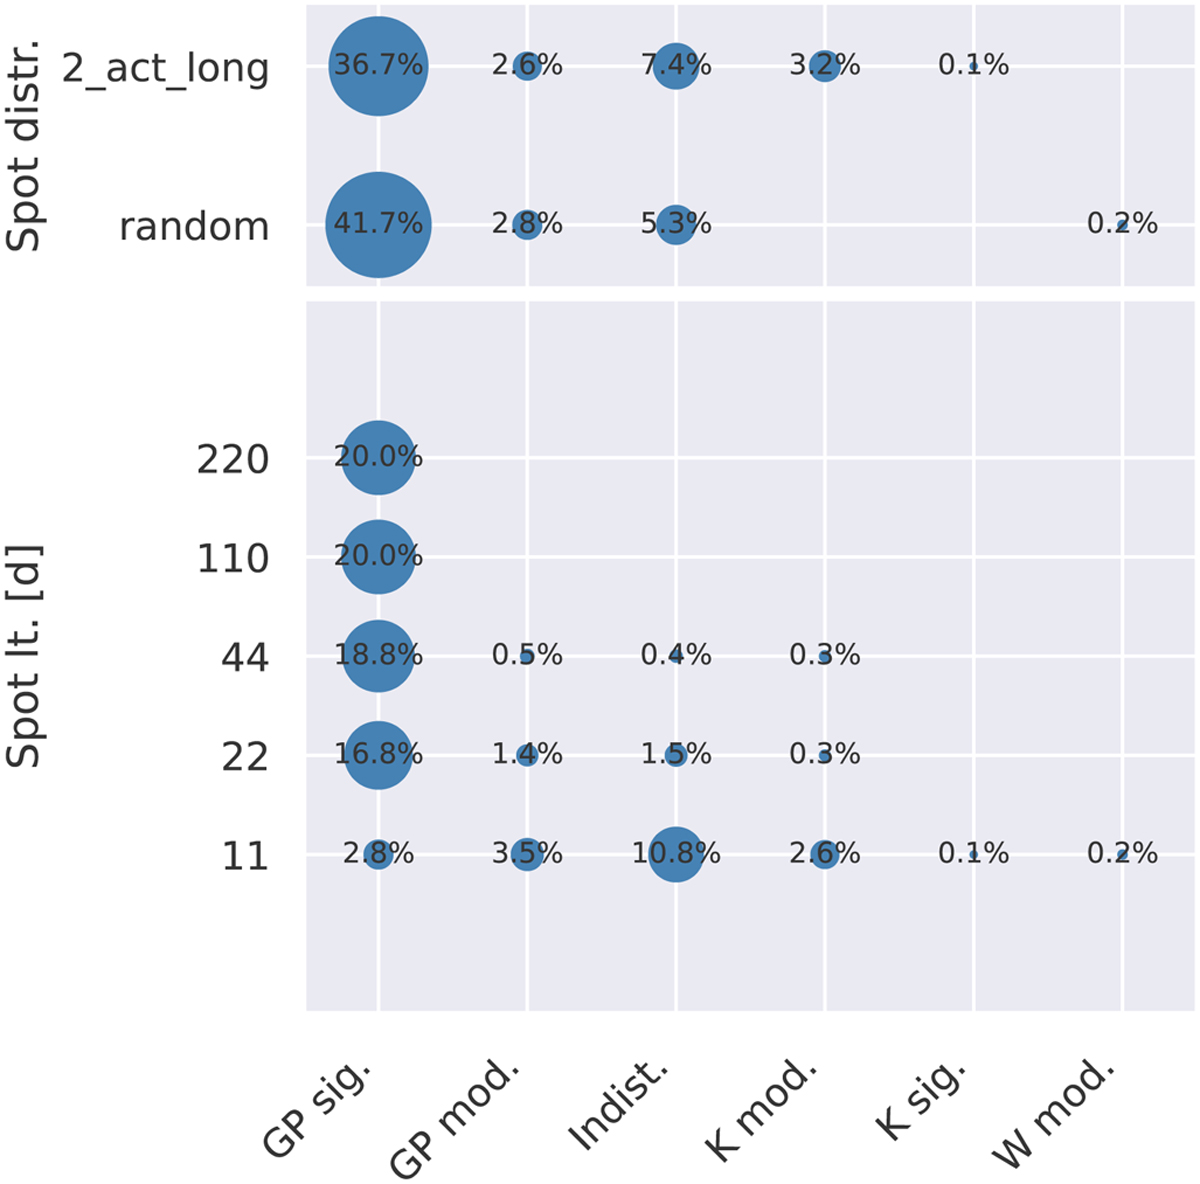
Single-model comparison of activity-only data. Shown is a breakdown of the values from Fig. B.1 into the different activity configurations. The percentages, also indicated by the point sizes, sum up to 100% for each configuration parameter category highlighted by the gray-shaded areas.
Current usage metrics show cumulative count of Article Views (full-text article views including HTML views, PDF and ePub downloads, according to the available data) and Abstracts Views on Vision4Press platform.
Data correspond to usage on the plateform after 2015. The current usage metrics is available 48-96 hours after online publication and is updated daily on week days.
Initial download of the metrics may take a while.