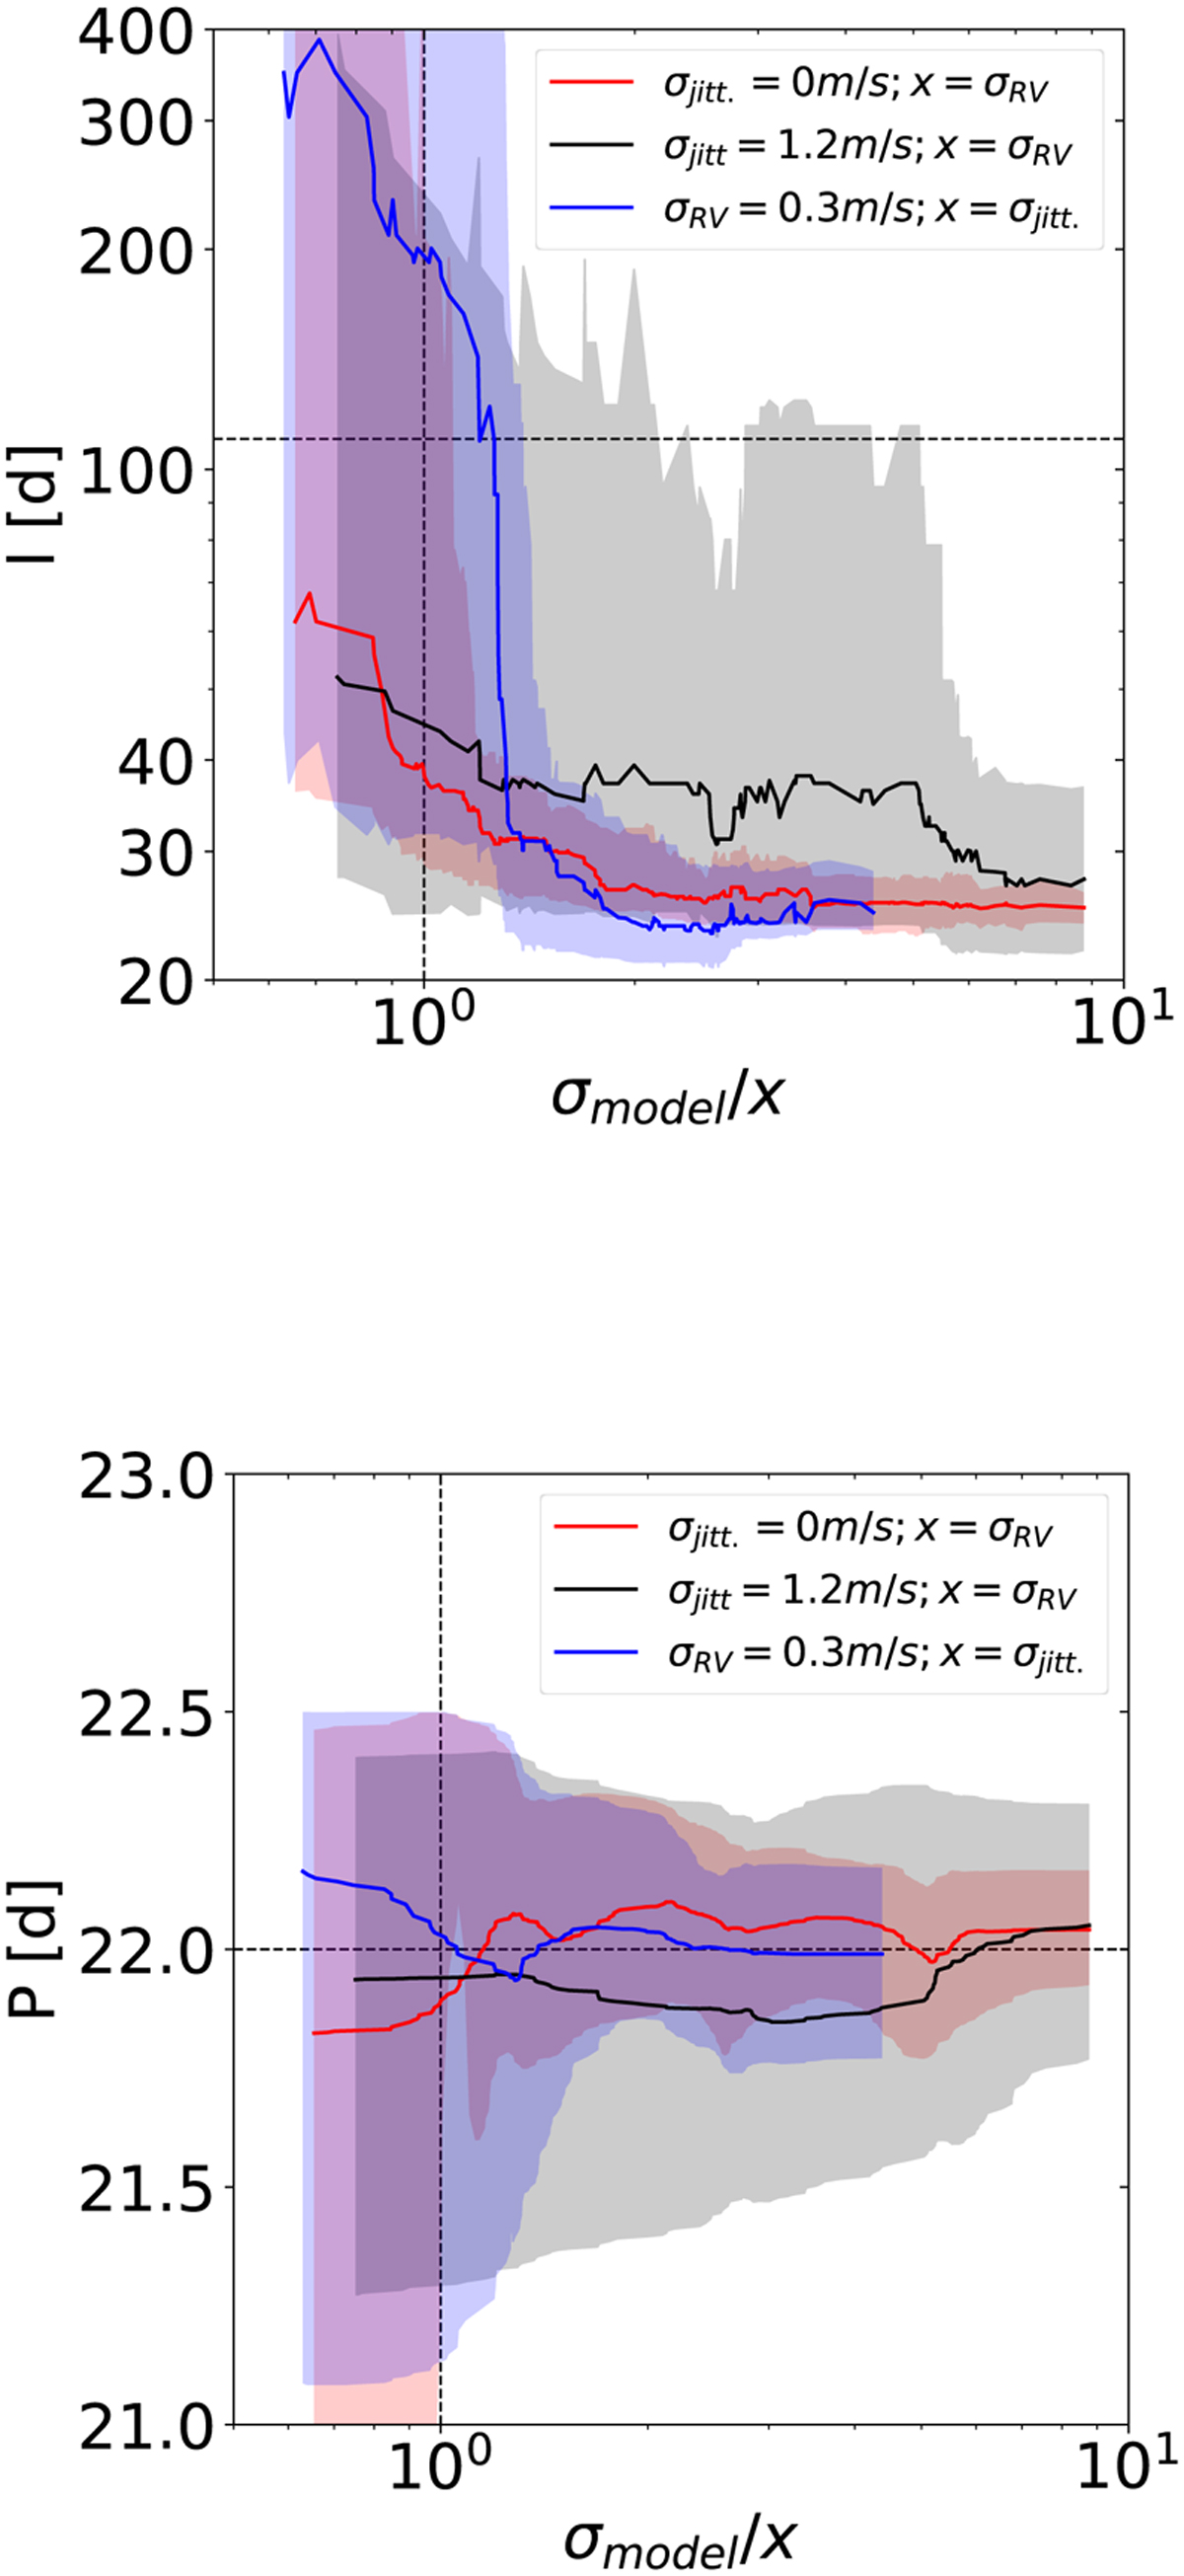
Fig. 4
Download original image
Relations of the derived GP parameters to the RV uncertainty. Top: derived GP length scale as a function of the ratio of the standard deviation of the stellar activity signal over the RV uncertainty or jitter. Note that only GP-only fits that had at least moderate significance (with ∆ ln 𝒵 > 2.5) compared to a white noise model that includes only jitter have been used. The curves were computed by applying a median filter with a window size incorporating 50 simulations. The red curve assumes a fixed jitter of σjitter = 0 m s−1 and changes the ratio σmodel/σRV, the black curve assumes a fixed jitter of σjitter = 1.2 m s−1 and changes the ratio σmodel/σRV, and the blue curve assumes a fixed uncertainty of σRV = 0.3 m s−1 and changes the ratio σmodel/σjitter. The colored shaded area shows the appropriate inter-quartile range. The vertical dotted line represents a ratio of 1. The horizontal dashed line represents the simulated spot lifetime. Bottom: analogous to the top plot, but for the GP rotation period.
Current usage metrics show cumulative count of Article Views (full-text article views including HTML views, PDF and ePub downloads, according to the available data) and Abstracts Views on Vision4Press platform.
Data correspond to usage on the plateform after 2015. The current usage metrics is available 48-96 hours after online publication and is updated daily on week days.
Initial download of the metrics may take a while.