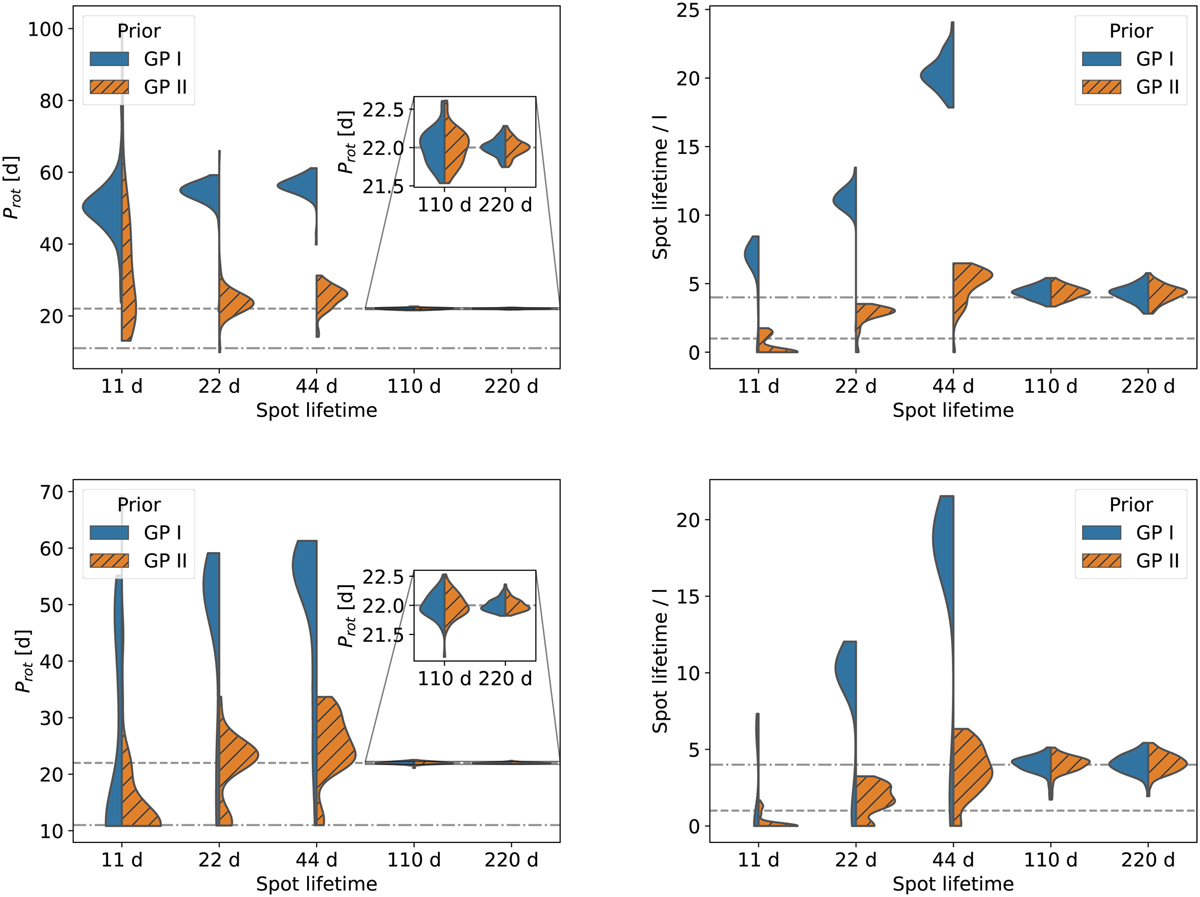
Fig. 3
Download original image
Violin plots showing the distribution of the derived median rotation periods and length scale hyperparameters of the QP–GP based on 100 simulations per spot lifetime. The blue distribution shows the results obtained from using GP Prior I (wide prior), and the orange distribution shows the results obtained by using GP Prior II (length scale constrained). For the period, the dashed line shows the simulated rotation period and the dash-dotted line the first harmonic at Prot/2. For the length scale, we show the simulated spot lifetime divided by the determined GP length scale so that the dashed line marks a 1:1 correspondence and the dash-dotted line a factor of 4 between the two. Top: for a random spot distribution on the stellar surface. Bottom: with two active longitudes on the stellar surface.
Current usage metrics show cumulative count of Article Views (full-text article views including HTML views, PDF and ePub downloads, according to the available data) and Abstracts Views on Vision4Press platform.
Data correspond to usage on the plateform after 2015. The current usage metrics is available 48-96 hours after online publication and is updated daily on week days.
Initial download of the metrics may take a while.