Fig. 2
Download original image
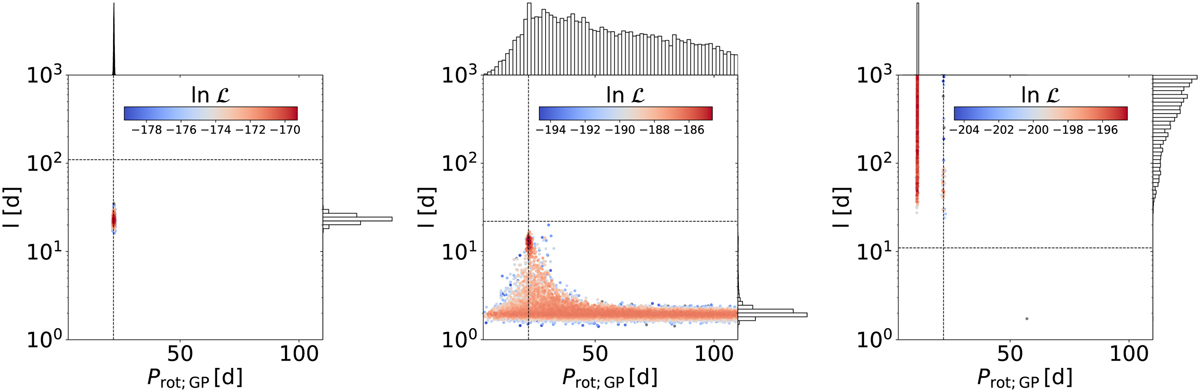
l versus P diagrams showing the posterior samples of a single GP fit with uninformed priors to one example simulation. The horizontal dashed line indicates the simulated spot lifetime, and the vertical dashed line indicates the simulated rotation period. Left: posterior samples fitted to a star with random spot distribution, Prot = 22 days, and Plife = 110 days. A well-behaved peak is found where both the rotation period and the GP length scale are well constrained. Middle: posterior samples fitted to a star with random spot distribution, Prot = 22 days, and Plife = 22 days. A posterior plateau with a short length scale spans the entire posterior volume. The posterior of the rotation period is not well constrained due to this plateau; however, some posterior samples form a “triangle” shape at the rotation period. Right: posterior samples fitted to a star with two active longitudes, Prot = 22 days, and Plife = 11 days. The spots that appear on a similar longitude mimic a coherent signal whose length scale cannot be constrained by the GP, resulting in an “I-shaped” posterior distribution that reaches the upper boundary of the posterior volume.
Current usage metrics show cumulative count of Article Views (full-text article views including HTML views, PDF and ePub downloads, according to the available data) and Abstracts Views on Vision4Press platform.
Data correspond to usage on the plateform after 2015. The current usage metrics is available 48-96 hours after online publication and is updated daily on week days.
Initial download of the metrics may take a while.