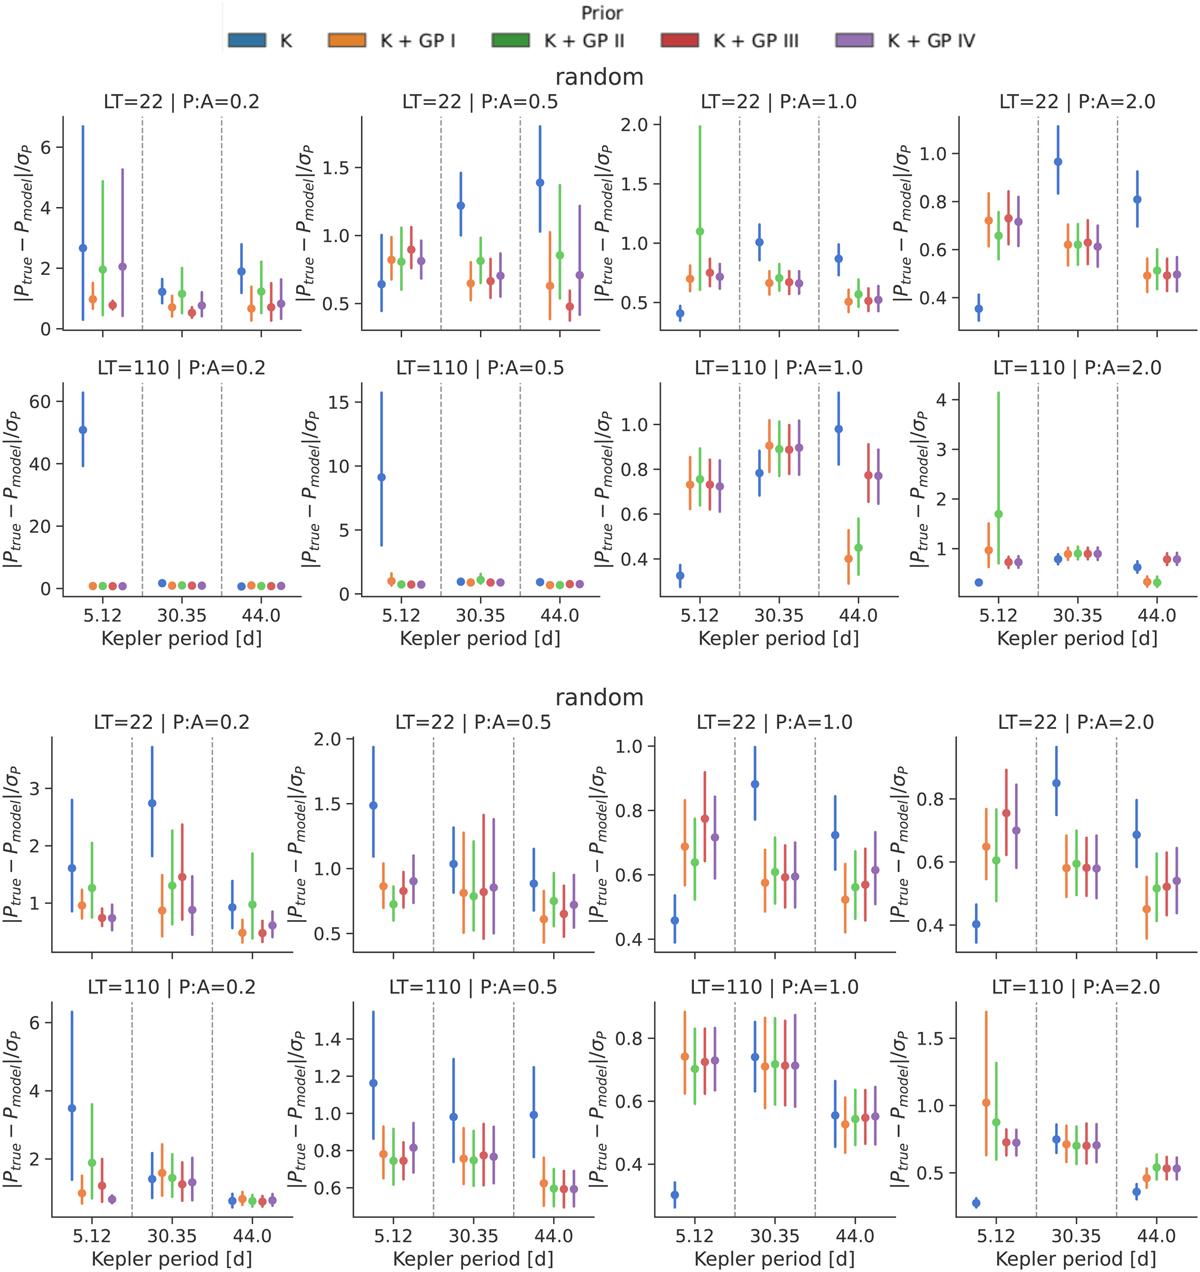
Fig. C.4
Download original image
Median of the absolute standard deviation distance between the injected and retrieved planetary orbital periods based on the median posteriors of 100 ensembles each. Each plot distinguishes between three different orbital periods (separated by the vertical dashed gray lines) and between the five differently applied models (distinguishable by the different color of the dots). The error bars show the 0.16 and 0.84 quartiles. The ratio of the injected planet amplitude to the modeled stellar rotational signal increases in favor of the planet signal from the left columns to right columns. The top eight plots show the results for a random spot distribution, and the lower eight plots show the results for two active longitudes on the stellar surface. These two cases are further separated into the top row, which shows the results for a simulated spot lifetime of 22 d, and the bottom row, which shows the results for a simulated spot lifetime of 110 d.
Current usage metrics show cumulative count of Article Views (full-text article views including HTML views, PDF and ePub downloads, according to the available data) and Abstracts Views on Vision4Press platform.
Data correspond to usage on the plateform after 2015. The current usage metrics is available 48-96 hours after online publication and is updated daily on week days.
Initial download of the metrics may take a while.