Open Access
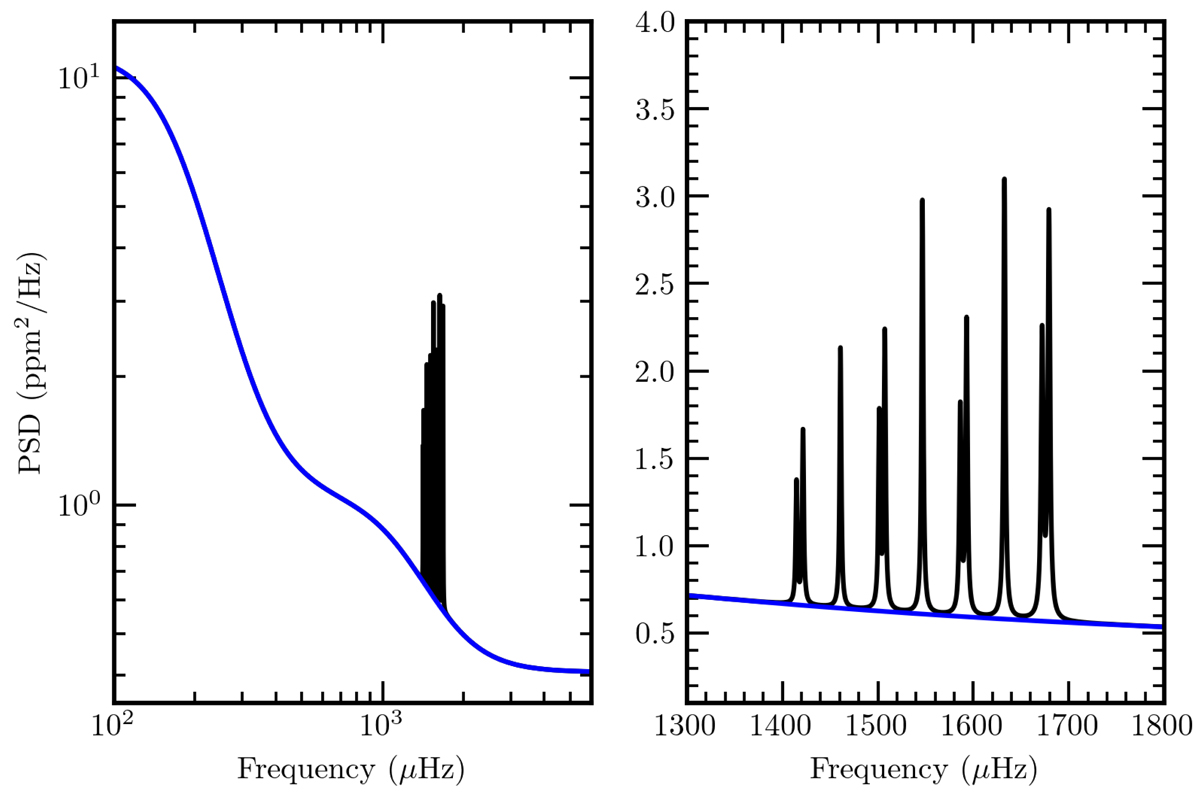
Fig. B.1.
Download original image
Monte Carlo simulations to probe the limit spectrum. Left panel: Limit spectrum of the 11 simulated modes based on EPIC 212485100 (black lines) as well as the contribution of the convective background and the photon noise (blue line). Right panel: Zoom onto the p modes.
Current usage metrics show cumulative count of Article Views (full-text article views including HTML views, PDF and ePub downloads, according to the available data) and Abstracts Views on Vision4Press platform.
Data correspond to usage on the plateform after 2015. The current usage metrics is available 48-96 hours after online publication and is updated daily on week days.
Initial download of the metrics may take a while.