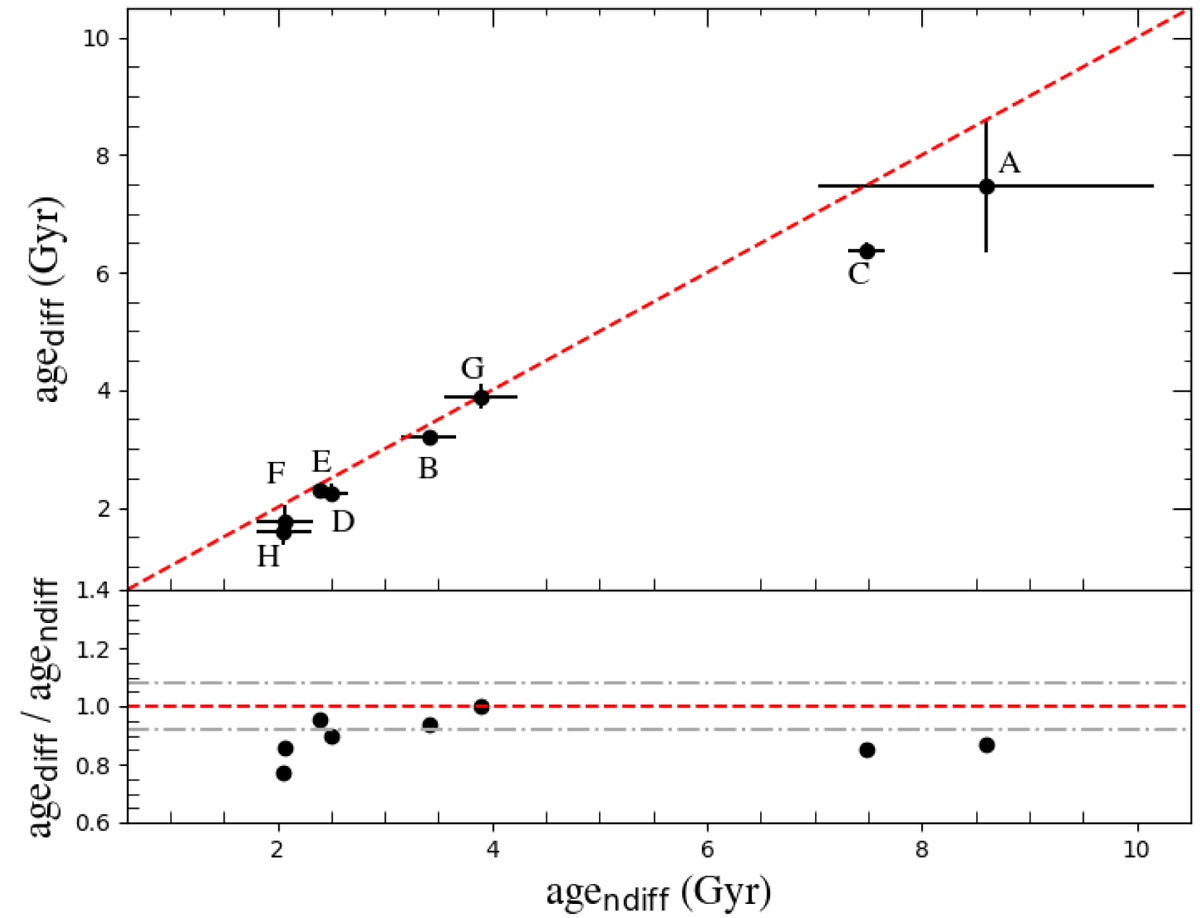
Fig. 6.
Download original image
Ages obtained with the IACgrid with diffusion vs ages from the IACgrid without diffusion (top panel). The one-to-one line is represented with the red dashed line. Ratio between the two different age computations as a function of the age from the IACgrid without diffusion (bottom panel). The red dashed line is the equality line while the gray dot-dashed lines correspond to the mean age uncertainty on stellar ages without diffusion of our sample (of 8%).
Current usage metrics show cumulative count of Article Views (full-text article views including HTML views, PDF and ePub downloads, according to the available data) and Abstracts Views on Vision4Press platform.
Data correspond to usage on the plateform after 2015. The current usage metrics is available 48-96 hours after online publication and is updated daily on week days.
Initial download of the metrics may take a while.