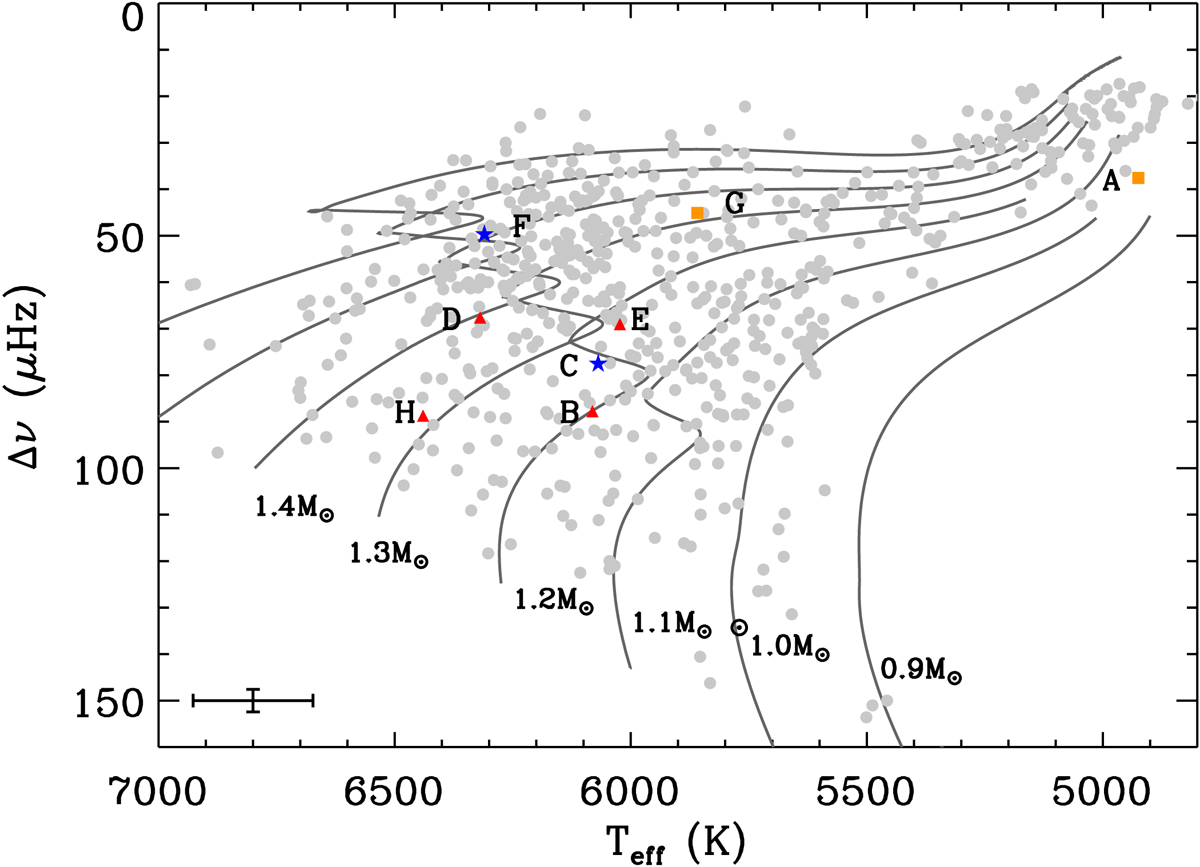
Fig. 3.
Download original image
Seismic Hertzsprung-Russell diagram, where the luminosity is modified by the mean large frequency spacing, Δν. The colored symbols represent the stars studied here: red triangles are the main sequence stars; blue stars are stars near the TAMS; orange squares are subgiants. The Kepler sample with detected solar-like oscillations (Mathur et al. 2022) are also represented with gray circles. The evolutionary tracks with solar metallicity from the Aarhus STellar Evolution Code (Christensen-Dalsgaard 2008a) are represented with the black lines. The average uncertainties on Teff and Δν are shown in the lower left corner.
Current usage metrics show cumulative count of Article Views (full-text article views including HTML views, PDF and ePub downloads, according to the available data) and Abstracts Views on Vision4Press platform.
Data correspond to usage on the plateform after 2015. The current usage metrics is available 48-96 hours after online publication and is updated daily on week days.
Initial download of the metrics may take a while.