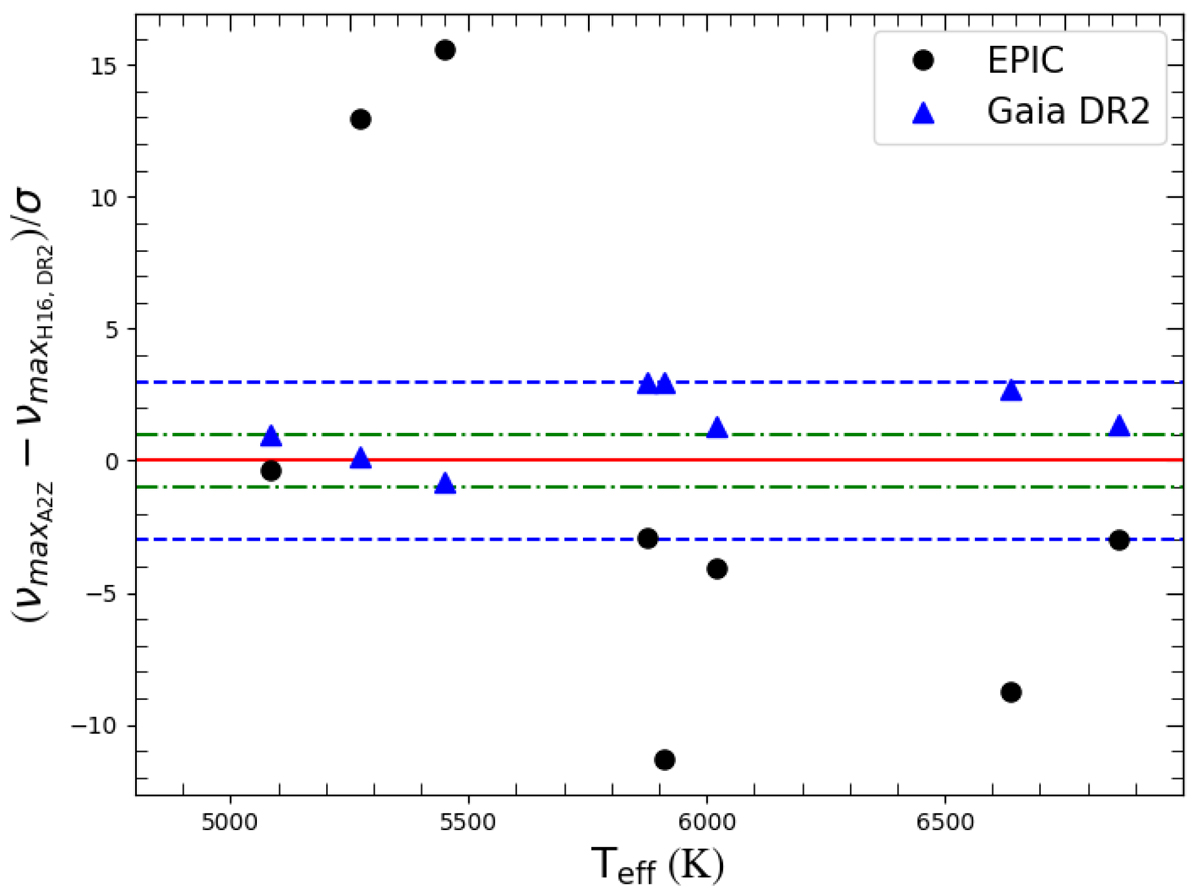
Fig. 2.
Download original image
Ratio of the difference between the observed νmax and the estimation from EPIC data (black circles) and Gaia DR2 data (blue triangles), and the combined uncertainties, σ. The green dot-dashed lines correspond to ±1σ and the blue dashed lines represent the 3σ limits, where sigma is the square root of the sum of the quadratic errors. The red continuous line depicts the null difference.
Current usage metrics show cumulative count of Article Views (full-text article views including HTML views, PDF and ePub downloads, according to the available data) and Abstracts Views on Vision4Press platform.
Data correspond to usage on the plateform after 2015. The current usage metrics is available 48-96 hours after online publication and is updated daily on week days.
Initial download of the metrics may take a while.