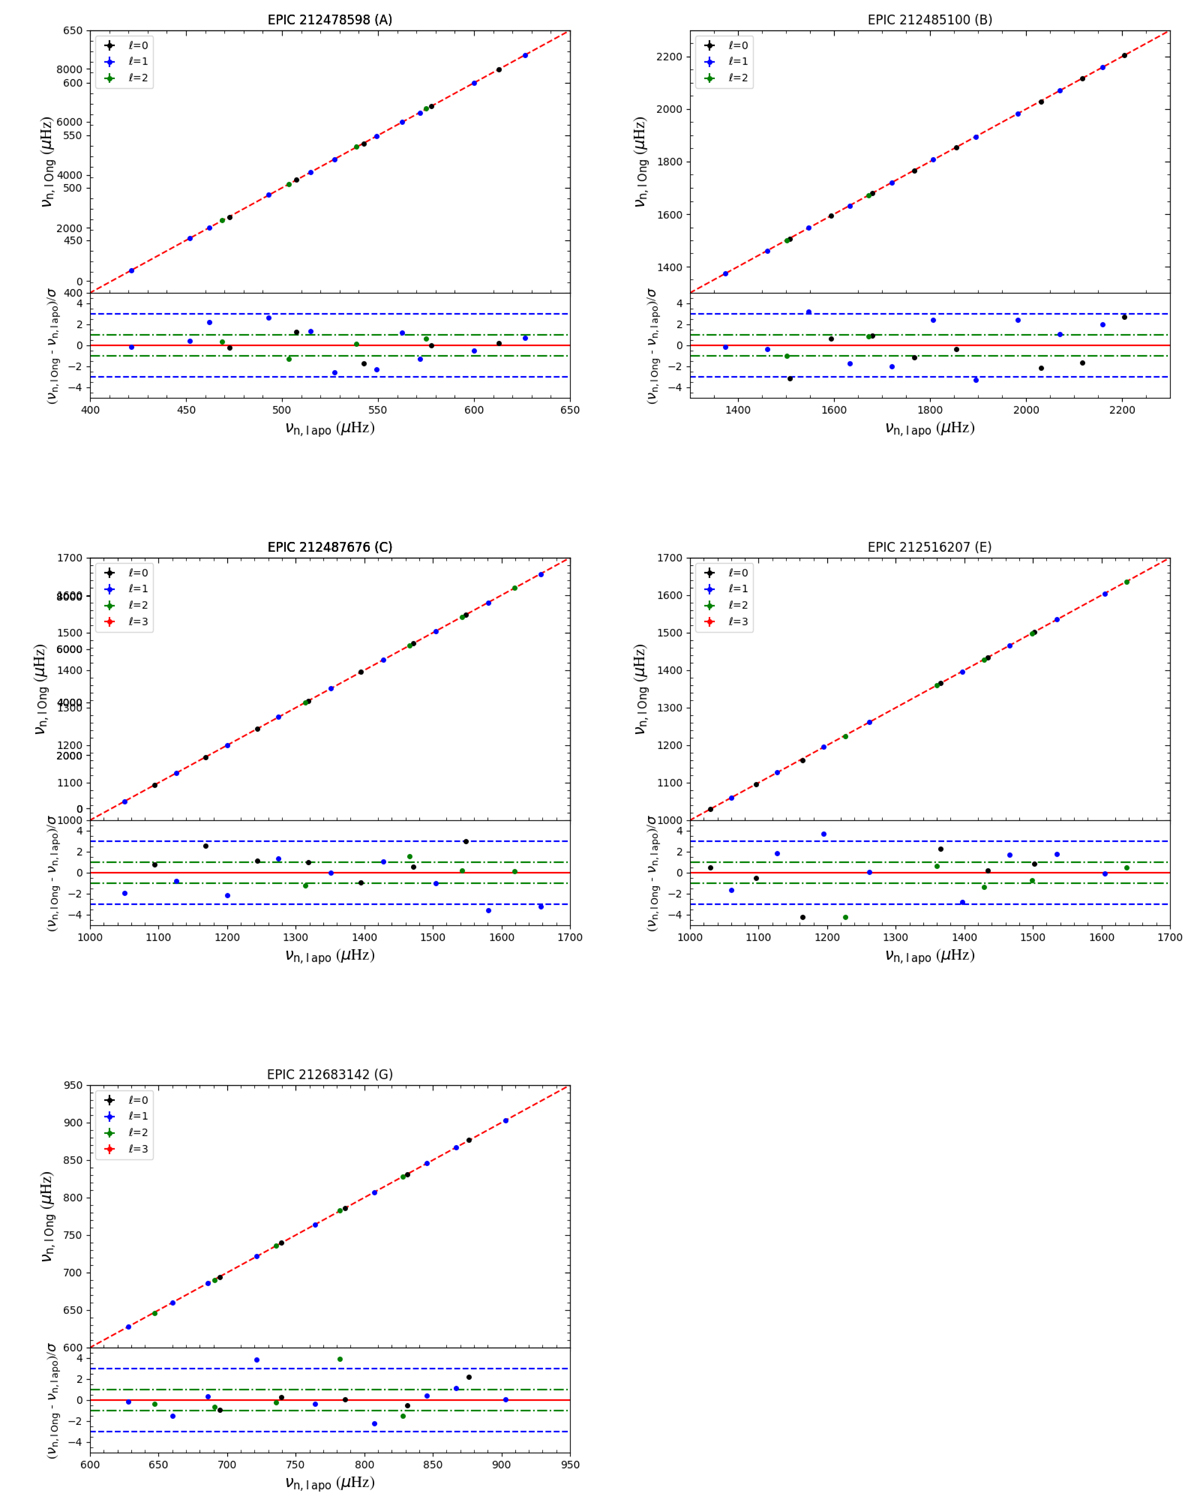
Fig. E.1.
Download original image
Comparison between the frequencies of modes in common obtained in this work (νn, l, apo) and those obtained in the analysis done by Ong et al. (2021), (νn, l, Ong). In the top panels, the red dashed line corresponds to the one-to-one line. In the bottom panels, we show the difference between the frequencies normalized by σ, which is computed as the square root of the quadratic sum of the frequency uncertainties from both methods. The green dash-dotted (blue dashed) lines correspond to ± 1 σ (± 3 σ).
Current usage metrics show cumulative count of Article Views (full-text article views including HTML views, PDF and ePub downloads, according to the available data) and Abstracts Views on Vision4Press platform.
Data correspond to usage on the plateform after 2015. The current usage metrics is available 48-96 hours after online publication and is updated daily on week days.
Initial download of the metrics may take a while.