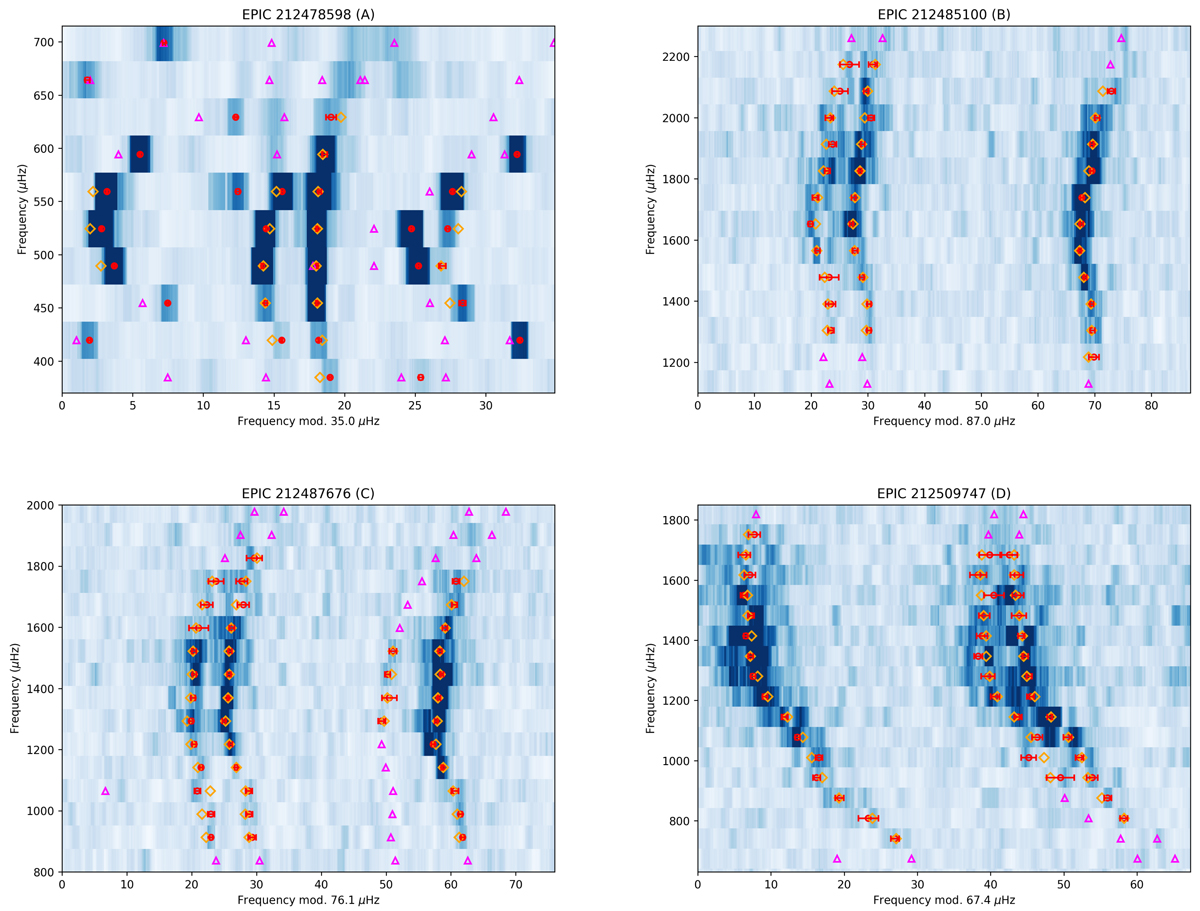
Fig. D.1.
Download original image
Echelle diagram of HD 115680 (A, EPIC 212478598), (top left panel); HD 116832 (B, EPIC 212485100), (top right panel); HD 114558 (C, EPIC 212487676), (bottom left panel); and HD 115427 (D, EPIC 212509747), (bottom right panel). The modes fitted by apollinaire are represented by red circles, while the orange diamonds correspond to the frequencies of the best-fit model after adding the surface corrections for the modes used as input. The magenta triangles represent the theoretical modes that were not part of the model-fitting procedure. Also, for the theoretical ℓ = 2 and 3 modes of HD 115680 (A, EPIC 212478598) star, only modes with a predominant p mode character are shown.
Current usage metrics show cumulative count of Article Views (full-text article views including HTML views, PDF and ePub downloads, according to the available data) and Abstracts Views on Vision4Press platform.
Data correspond to usage on the plateform after 2015. The current usage metrics is available 48-96 hours after online publication and is updated daily on week days.
Initial download of the metrics may take a while.