Fig. 9.
Download original image
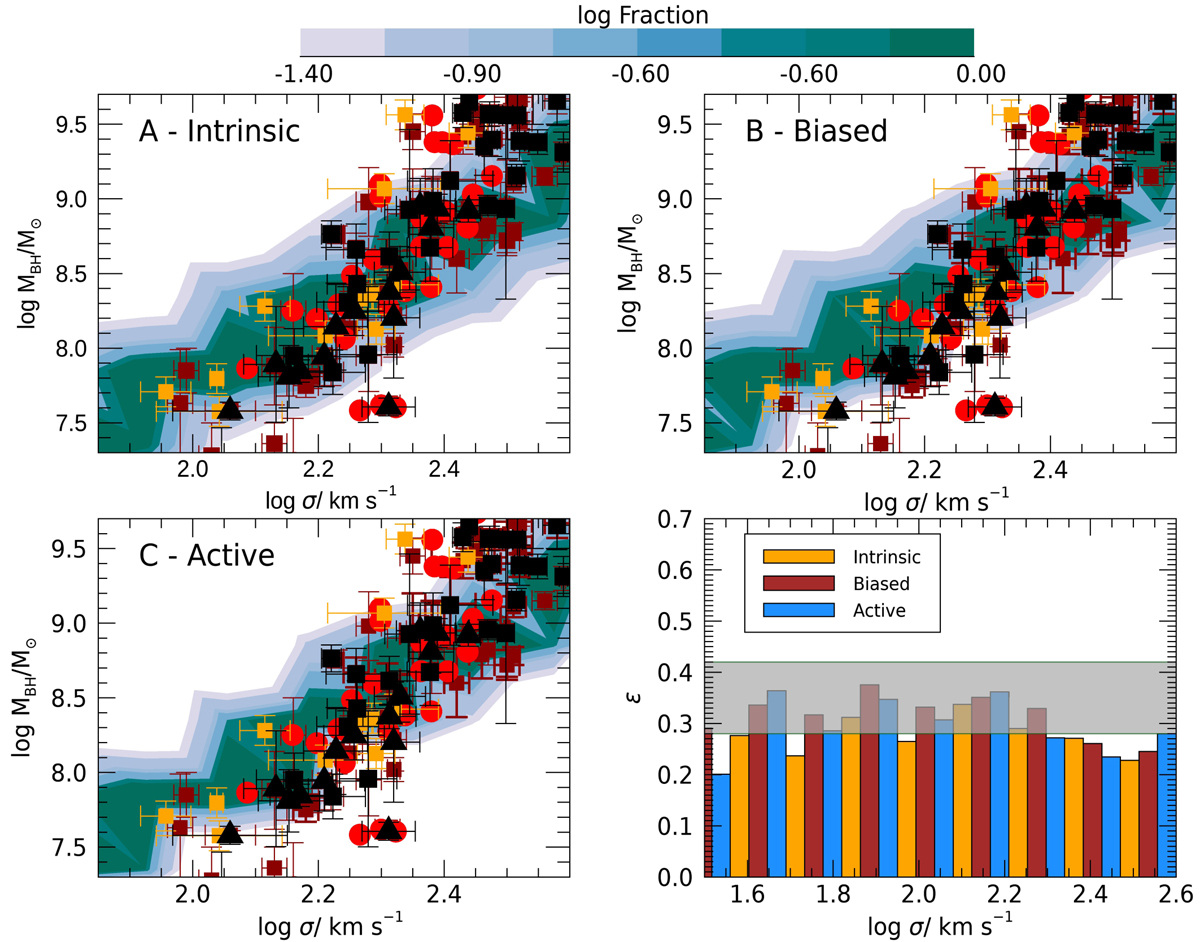
Comparison of our predicted MBH − σ relation with data for all galaxies at z ≤ 0.1. The color code corresponds to the logarithm of the fraction of galaxies with different MBH in a given log σ bin. Panel A: Predicted relation between the BH mass MBH and the bulge velocity dispersion σ brightness-weighted averaged over the galaxy. The data points are from Kormendy & Ho (2013; black squares and triangles for elliptical galaxies and bulges, respectively), De Nicola et al. (2019; brown squares), Savorgnan & Graham (2016; red dots), and Ho & Kim (2014; orange filled squares). Panel B: Same as panel A, but including in the model the selection bias discussed in Sect. 3, i.e., considering only model galaxies that satisfy the condition in Eq. (12) with θcrit = 0.1. Panel C: Same as panel A, but considering only model galaxies hosting AGN with bolometric luminosity LAGN ≥ 1044 erg/s. Bottom right panel: Histograms represent the rms values of the scatter for the distributions shown in the top left (brown), top right (blue), and bottom left panel (orange). The horizontal strip represents the range of values obtained from different observational works: the upper bound is the intrinsic scatter ϵ derived by De Nicola et al. (2019), and the lower bound is the value of ϵ derived by the least-square fit analysis by Kormendy & Ho (2013) using individual errors in log σ, adding individual errors in log MBH to the intrinsic scatter in quadrature, and iterating the intrinsic scatter until the reduced χ2 = 1.
Current usage metrics show cumulative count of Article Views (full-text article views including HTML views, PDF and ePub downloads, according to the available data) and Abstracts Views on Vision4Press platform.
Data correspond to usage on the plateform after 2015. The current usage metrics is available 48-96 hours after online publication and is updated daily on week days.
Initial download of the metrics may take a while.