Fig. 5.
Download original image
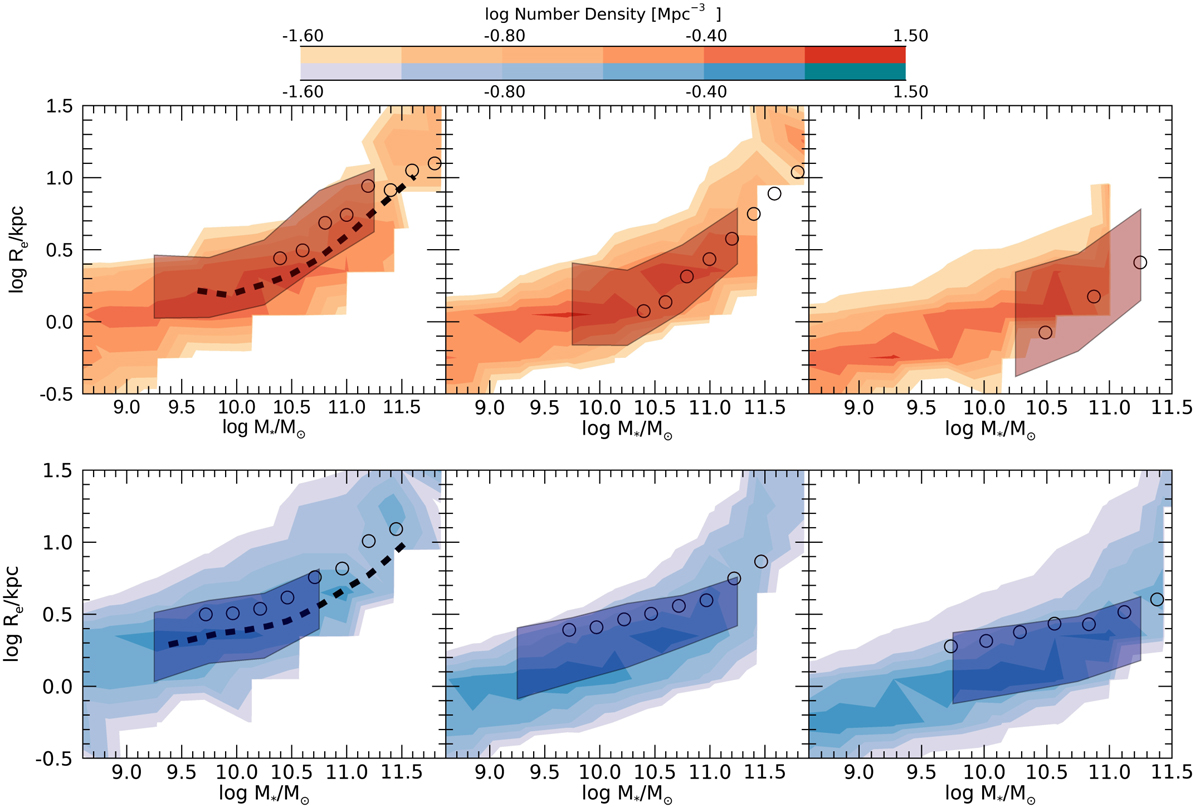
Predicted distribution of the effective radius Re shown as a function of the stellar mass M* at redshifts z = 0.25, z = 1.51, and z = 2.25 (from left to right) for early-type (top row) and late-type galaxies (bottom row). The predictions are compared with the data from van der Wel et al. (2014; shaded areas). We also show the size-stellar mass relation measured at z = 0.1 by Bernardi et al. (2014) and Mowla et al. (2019) as dashed lines and dots, respectively.
Current usage metrics show cumulative count of Article Views (full-text article views including HTML views, PDF and ePub downloads, according to the available data) and Abstracts Views on Vision4Press platform.
Data correspond to usage on the plateform after 2015. The current usage metrics is available 48-96 hours after online publication and is updated daily on week days.
Initial download of the metrics may take a while.