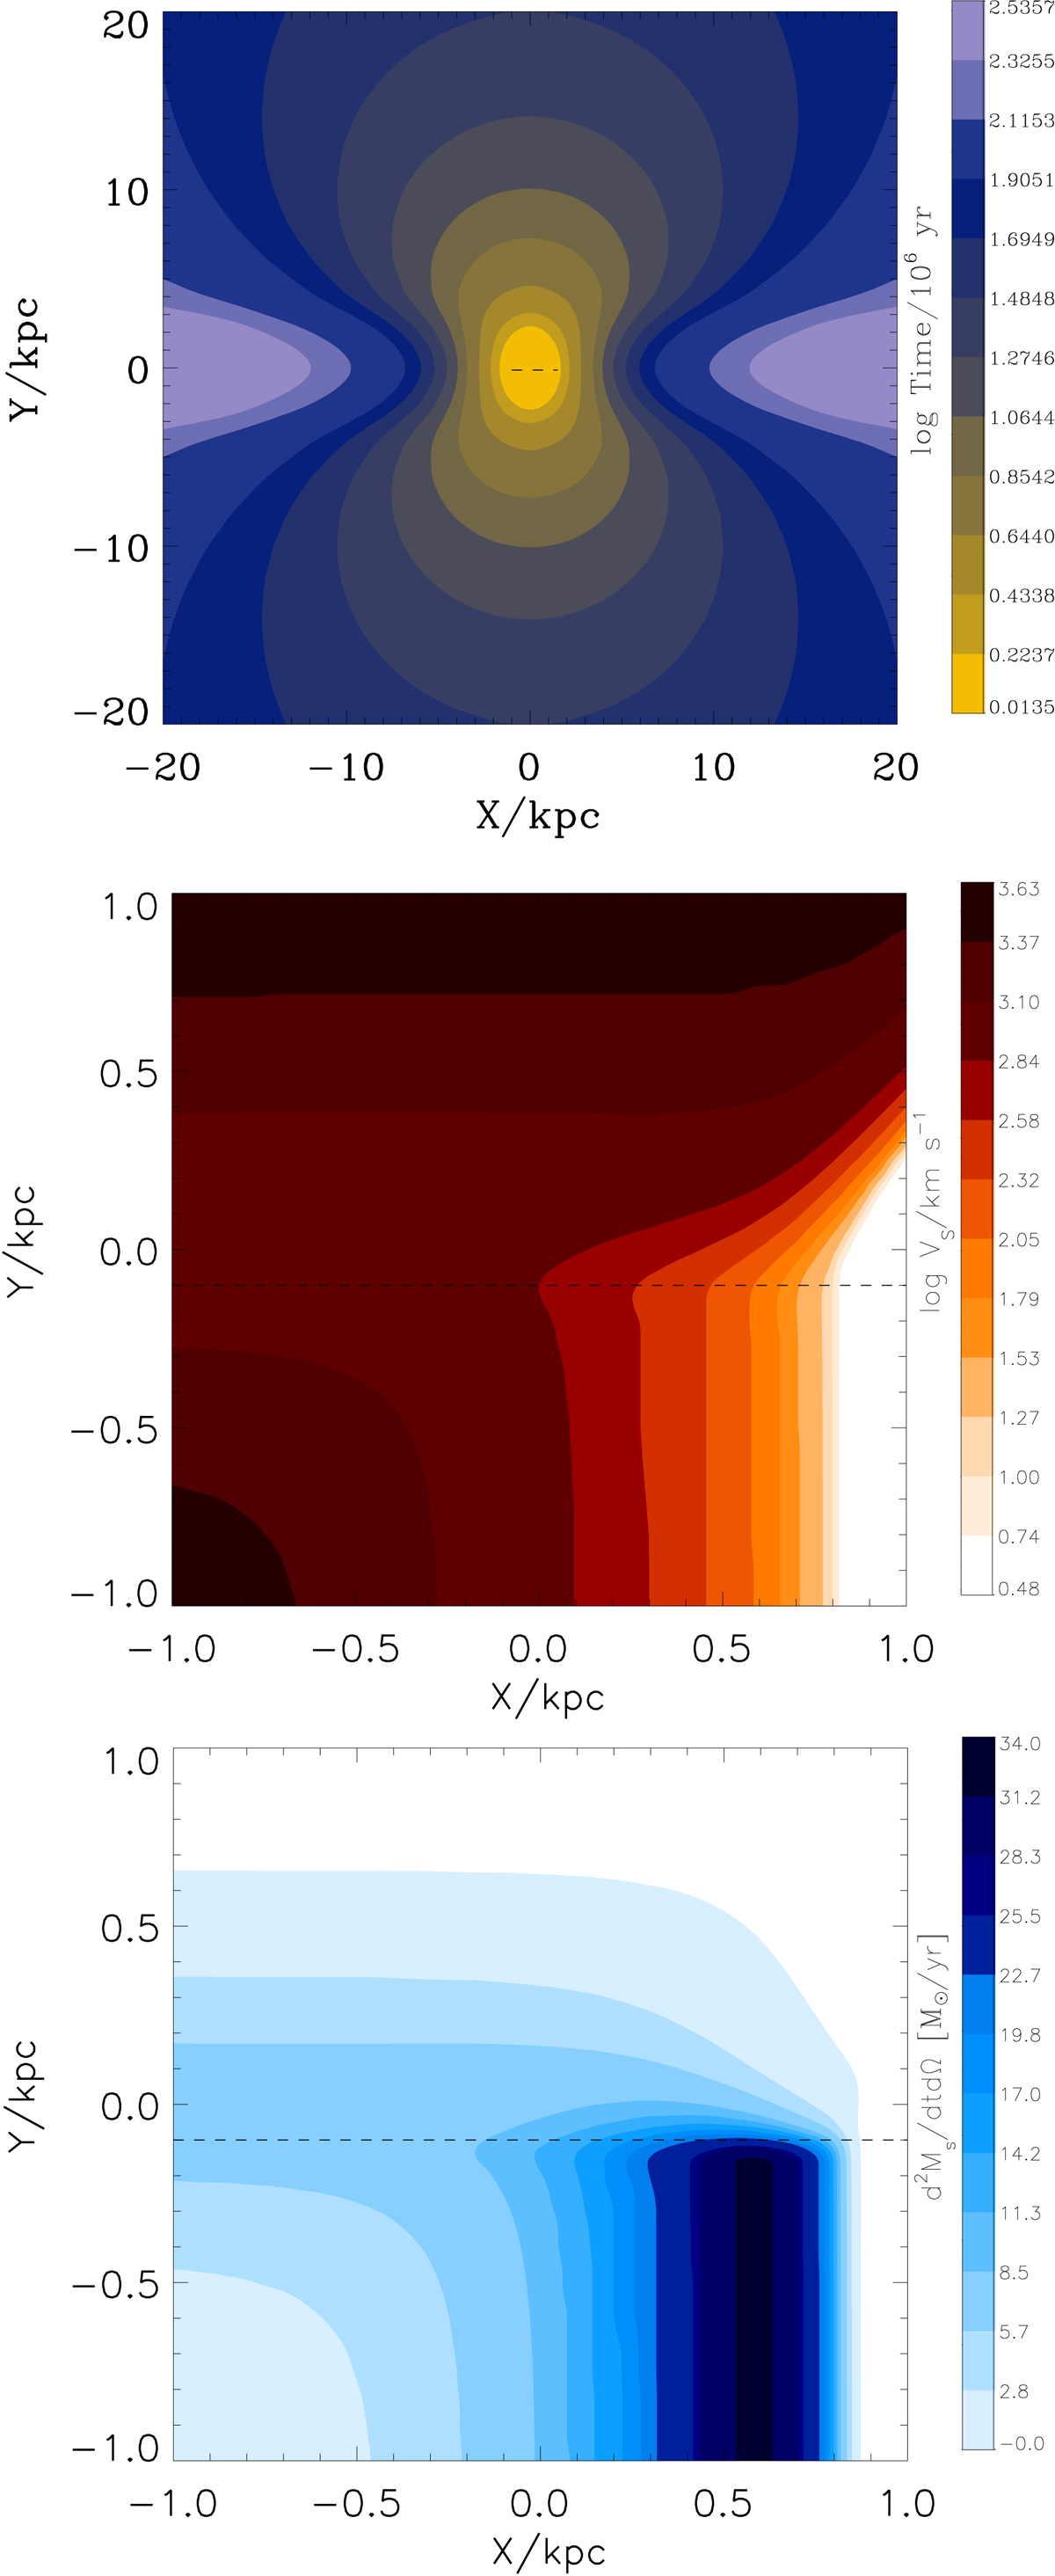
Fig. 1.
Download original image
Properties of shock expansion for our reference galaxy. In the top panel we show the positions of the shock at the different times represented by different colors and displayed in the right bar. The central and bottom panels show the velocity map and mass outflow rate map, respectively. The values corresponding to the colored contours are displayed in the bars. The X and Y coordinates correspond to the distance from the galaxy center in the directions parallel and perpendicular to the plane of the disk, respectively.
Current usage metrics show cumulative count of Article Views (full-text article views including HTML views, PDF and ePub downloads, according to the available data) and Abstracts Views on Vision4Press platform.
Data correspond to usage on the plateform after 2015. The current usage metrics is available 48-96 hours after online publication and is updated daily on week days.
Initial download of the metrics may take a while.