Fig. 5
Download original image
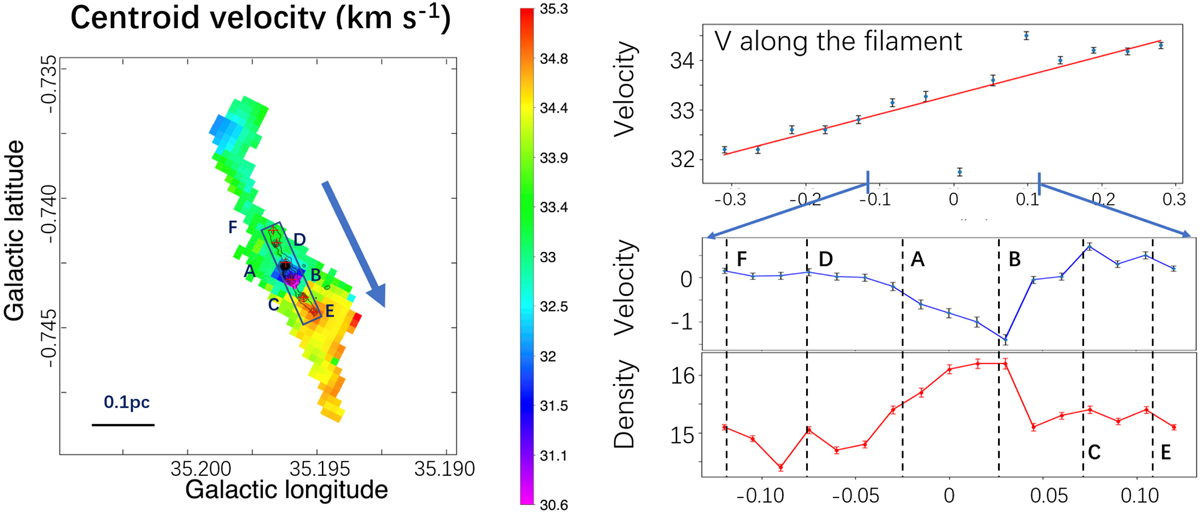
Velocity and column density in G35.20. Left: NH3 fitted centroid velocity overlaid with ALMA 870 μm contours as in Fig. 3. The box and arrow indicate how the PV cuts are made on the right panels. Right: The top panel is a PV cut showing the averaged centroid velocity (beam by beam) of the entire NH3 filament along the direction pointed by the arrow in the left panel, starting from the northern end down to the southern end of the NH3 filament shown in the left panel. The zero point is located between cores A and B. The red line is a linear fit excluding data between cores A and B. The middle panel is a pixel-by-pixel (instead of beam by beam) PV cut along the black-box region in the left panel after subtracting a global velocity gradient (red line in top panel). The bottom panel corresponds to the NH3 column density profile. The positions of the six ALMA cores A-F are marked with dashed vertical lines.
Current usage metrics show cumulative count of Article Views (full-text article views including HTML views, PDF and ePub downloads, according to the available data) and Abstracts Views on Vision4Press platform.
Data correspond to usage on the plateform after 2015. The current usage metrics is available 48-96 hours after online publication and is updated daily on week days.
Initial download of the metrics may take a while.