Fig. 4
Download original image
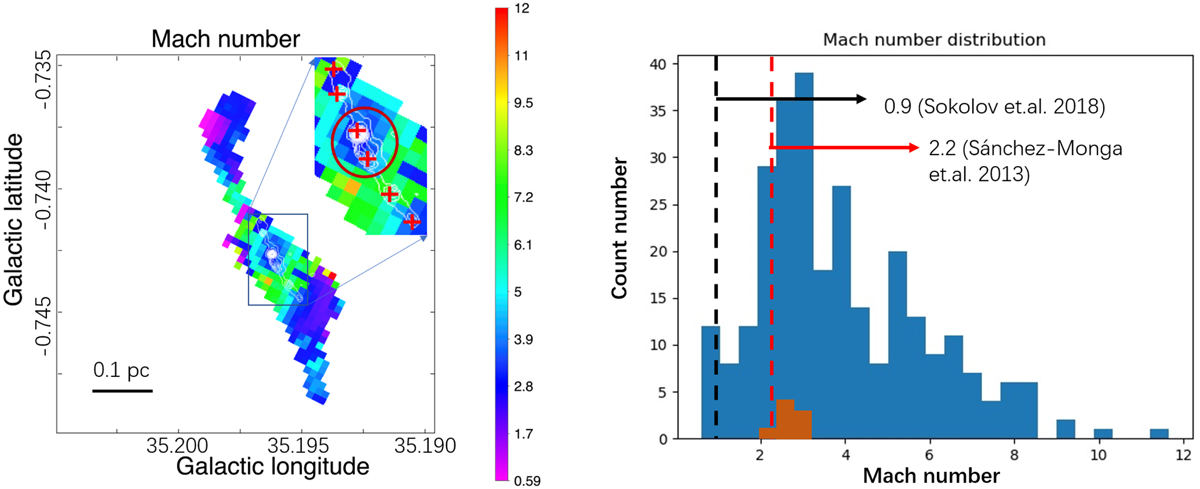
Mach number (left) and its pixel distribution (right). The white contours and red crosses mark the ALMA 870 μm emission cores, with contour levels the same as in Fig. 1. The dashed black and red vertical lines mark the typical Mach number in the literature, representative of quiescent and protostellar stages, respectively. The brown histogram corresponds to the brown circle of the central region (covering cores A and B), and the blue histogram is that of the whole G35.2 clump.
Current usage metrics show cumulative count of Article Views (full-text article views including HTML views, PDF and ePub downloads, according to the available data) and Abstracts Views on Vision4Press platform.
Data correspond to usage on the plateform after 2015. The current usage metrics is available 48-96 hours after online publication and is updated daily on week days.
Initial download of the metrics may take a while.