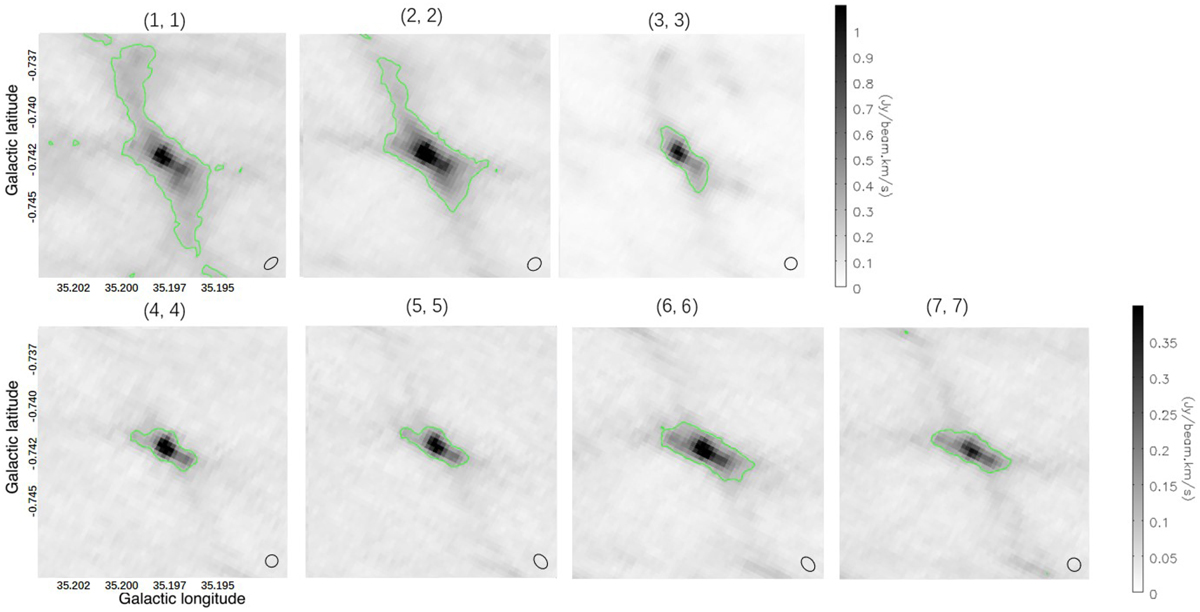
Fig. 2
Download original image
Flux-integrated maps of JVLA NH3 lines from (1,1) to (7,7) in G35.20-0.74 N. Upper row: From left to right are NH3 (1,1) to (3,3) shown in the same color bar. Ellipses in the bottom-right corner are synthesized beams of each line image. Contours show the 3σ level of each line-integrated map. Lower row: Similar to the upper row but for lines from (4,4) to (7,7), with a different color bar.
Current usage metrics show cumulative count of Article Views (full-text article views including HTML views, PDF and ePub downloads, according to the available data) and Abstracts Views on Vision4Press platform.
Data correspond to usage on the plateform after 2015. The current usage metrics is available 48-96 hours after online publication and is updated daily on week days.
Initial download of the metrics may take a while.