Open Access
Fig. 26.
Download original image
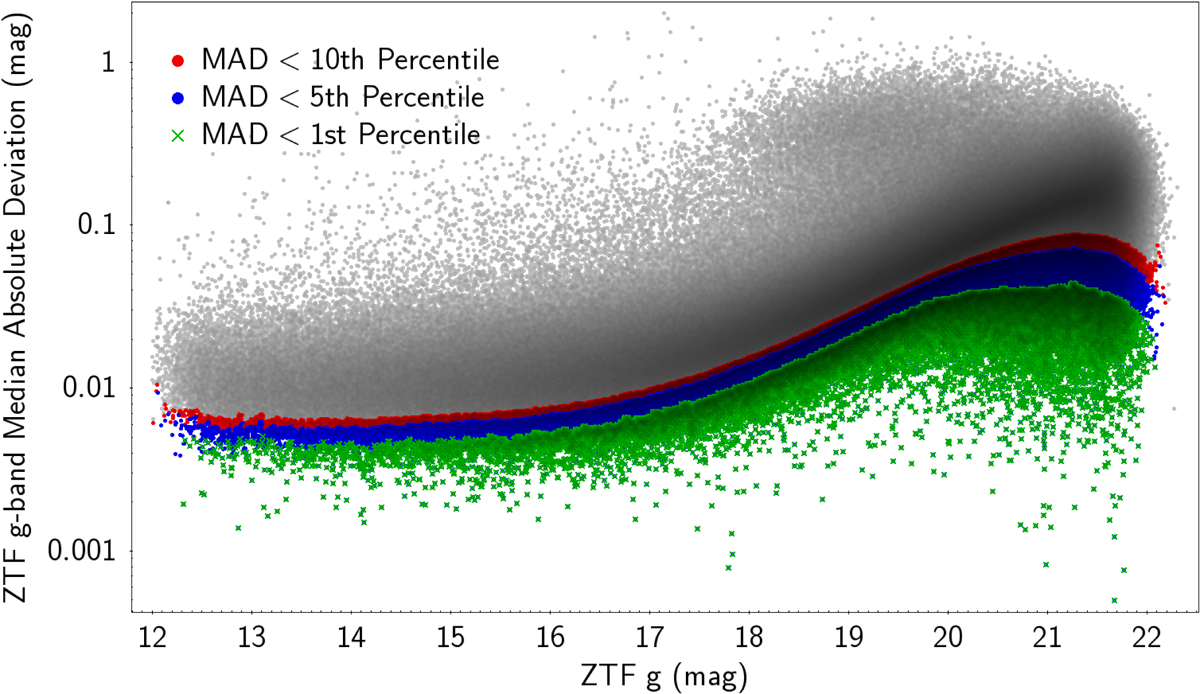
MAD vs. magnitude per percentile cut for the ZTF sources in this work. Sources between the tenth and fifth percentiles are plotted in red, those with a MAD between the fifth and first percentiles are shown in blue, and those below the first percentile are presented as green crosses.
Current usage metrics show cumulative count of Article Views (full-text article views including HTML views, PDF and ePub downloads, according to the available data) and Abstracts Views on Vision4Press platform.
Data correspond to usage on the plateform after 2015. The current usage metrics is available 48-96 hours after online publication and is updated daily on week days.
Initial download of the metrics may take a while.