Open Access
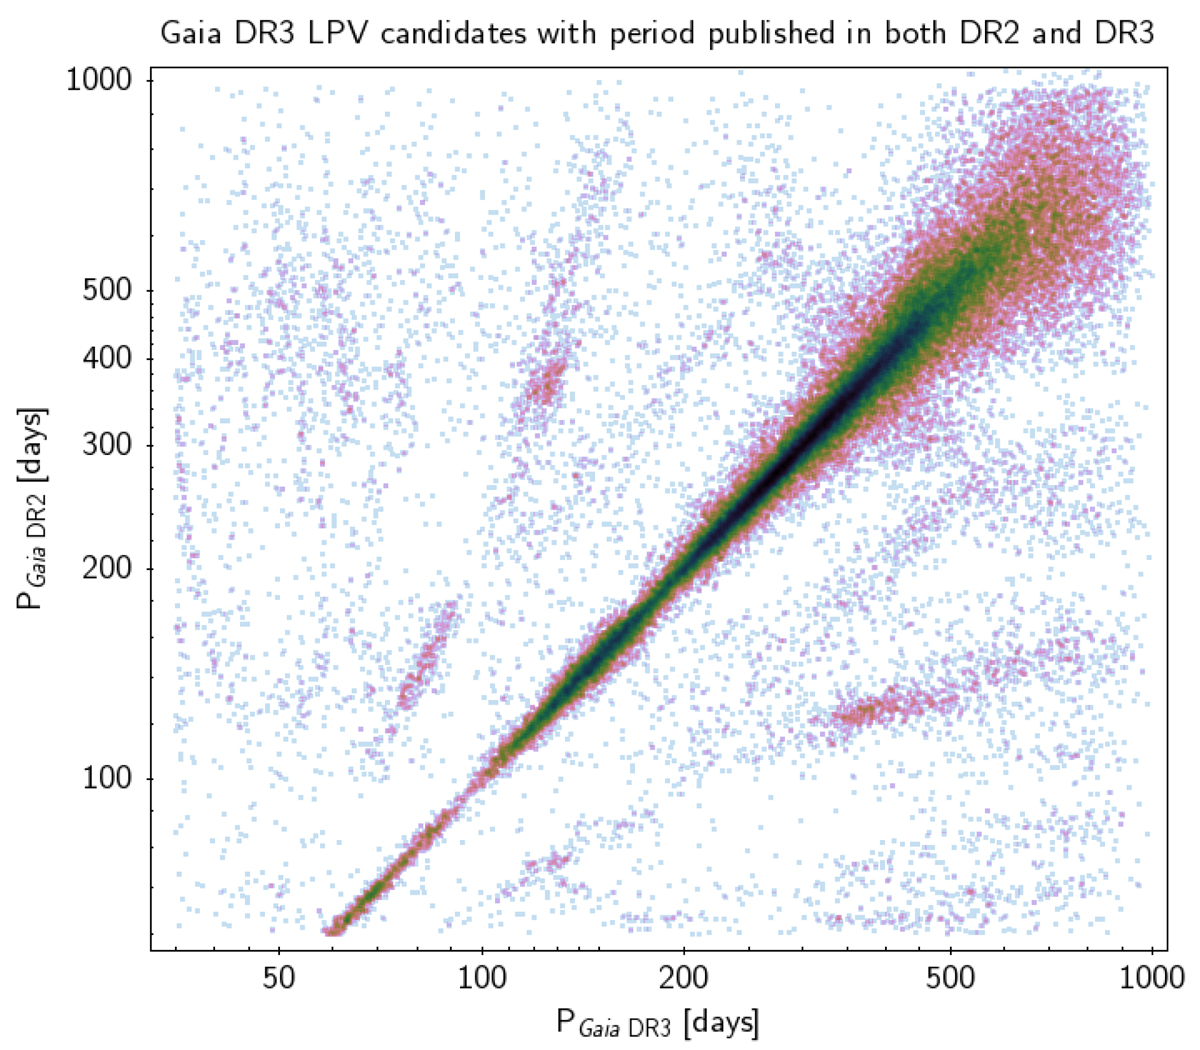
Fig. 8.
Download original image
Density-mapped comparison of the periods published in DR2 and DR3 for the LPV candidates common to the two data releases. The colour tone extends from blue to red and moves towards progressively more densely populated areas of the plot.
Current usage metrics show cumulative count of Article Views (full-text article views including HTML views, PDF and ePub downloads, according to the available data) and Abstracts Views on Vision4Press platform.
Data correspond to usage on the plateform after 2015. The current usage metrics is available 48-96 hours after online publication and is updated daily on week days.
Initial download of the metrics may take a while.