Fig. 7.
Download original image
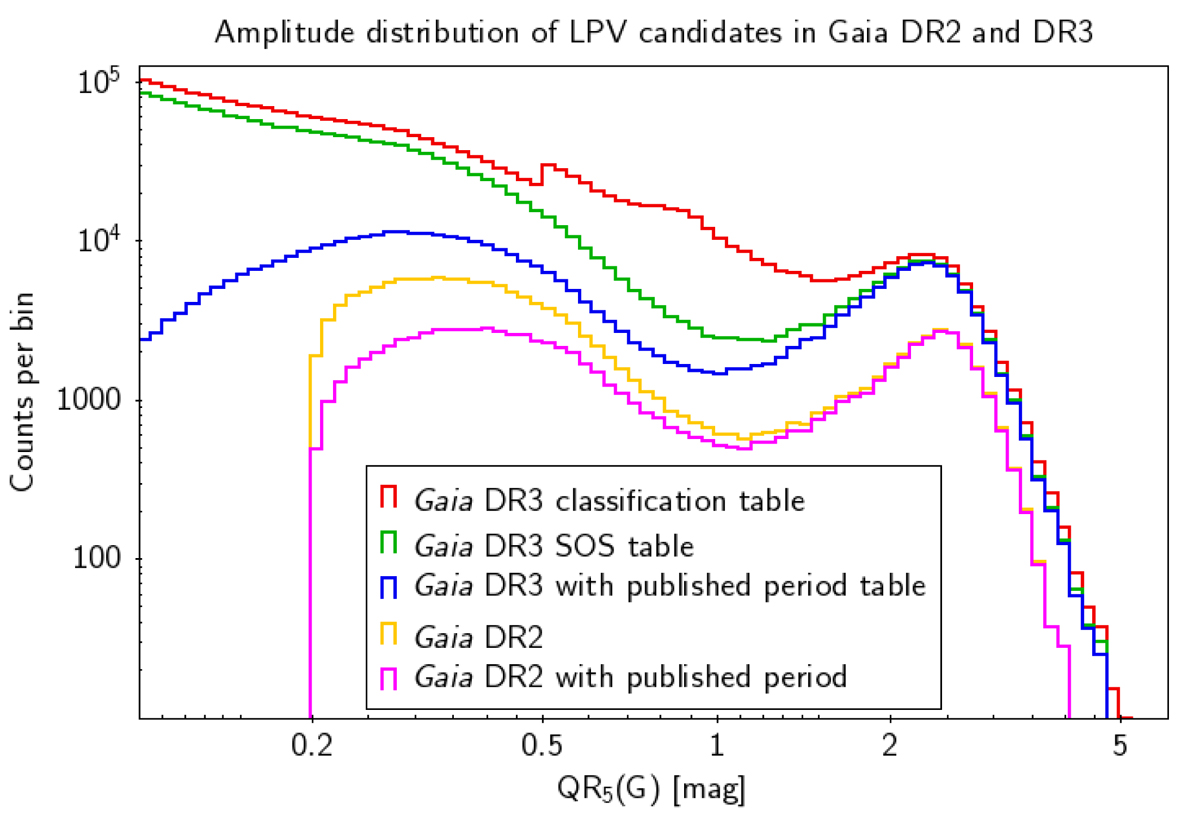
Distribution of the G-band variability amplitude (traced by the 5–95% interquantile range, QR5(G)) for the Gaia DR3 LPV candidates of the classification table (red), the SOS table (green), and those with a published period (blue). The content of the Gaia DR2 catalogue of LPV candidates (yellow), and its subset with periods published in DR2 (magenta), is also shown for comparison. A logarithmic scale is used along the vertical axis.
Current usage metrics show cumulative count of Article Views (full-text article views including HTML views, PDF and ePub downloads, according to the available data) and Abstracts Views on Vision4Press platform.
Data correspond to usage on the plateform after 2015. The current usage metrics is available 48-96 hours after online publication and is updated daily on week days.
Initial download of the metrics may take a while.