Fig. B.4.
Download original image
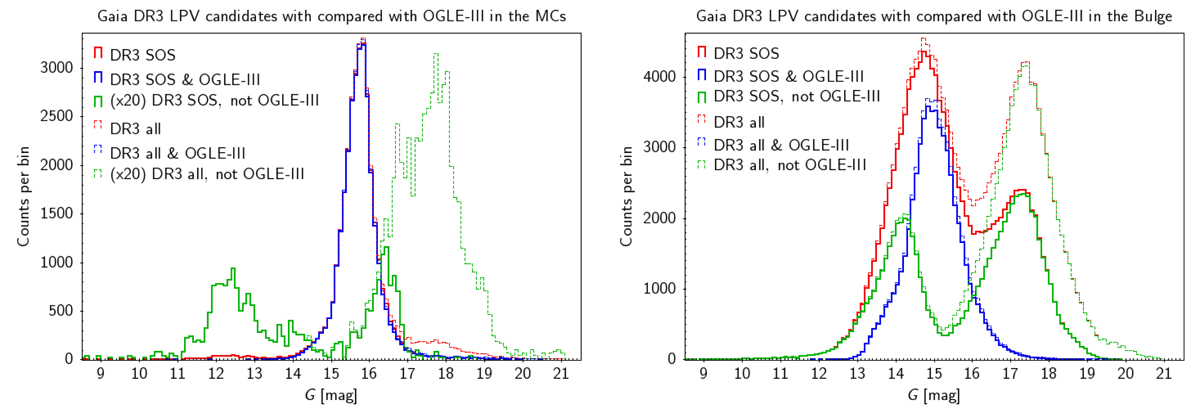
Similar to Fig. 23, but showing the brightness distribution of the sources in the dataset obtained by combining the LPV candidates resulting from the Gaia DR3 SOS and classification modules. The full set of sources in the direction of the MCs (left) or Galactic bulge (right) OGLE-III fields are shown with red lines. Blue lines correspond to sources matched with OGLE-III, while newly discovered candidates are represented by the green lines. Solid lines are limited to the sources resulting from the SOS module, and dashed lines include the output of the classification module as well. The green lines in the left panel show counts enhanced by a factor 20 for visual clarity.
Current usage metrics show cumulative count of Article Views (full-text article views including HTML views, PDF and ePub downloads, according to the available data) and Abstracts Views on Vision4Press platform.
Data correspond to usage on the plateform after 2015. The current usage metrics is available 48-96 hours after online publication and is updated daily on week days.
Initial download of the metrics may take a while.